")
How Compound Interest Works: A Complete Guide to Understanding Your Money’s Growth
Compound interest is often called the eighth wonder of the world, and for good reason. It’s the financial mechanism that allows your money to grow exponentially over time, turning modest savings into substantial wealth. Yet despite its importance, many people don’t fully grasp how compound interest works or why it can make such a dramatic difference in their financial future.
Understanding how compound interest works isn’t just academic knowledge—it’s practical wisdom that affects every financial decision you make, from choosing a savings account to planning for retirement. Whether you’re saving for a goal or paying off debt, the principles of compounding are constantly at work, either helping you build wealth or, if you’re on the wrong side of it, increasing what you owe.
In this comprehensive guide, we’ll break down exactly how compound interest works, explore its mathematical foundations, examine real-world applications, and show you why time is your most valuable financial asset.
What Exactly Is Compound Interest, in Simple Terms?
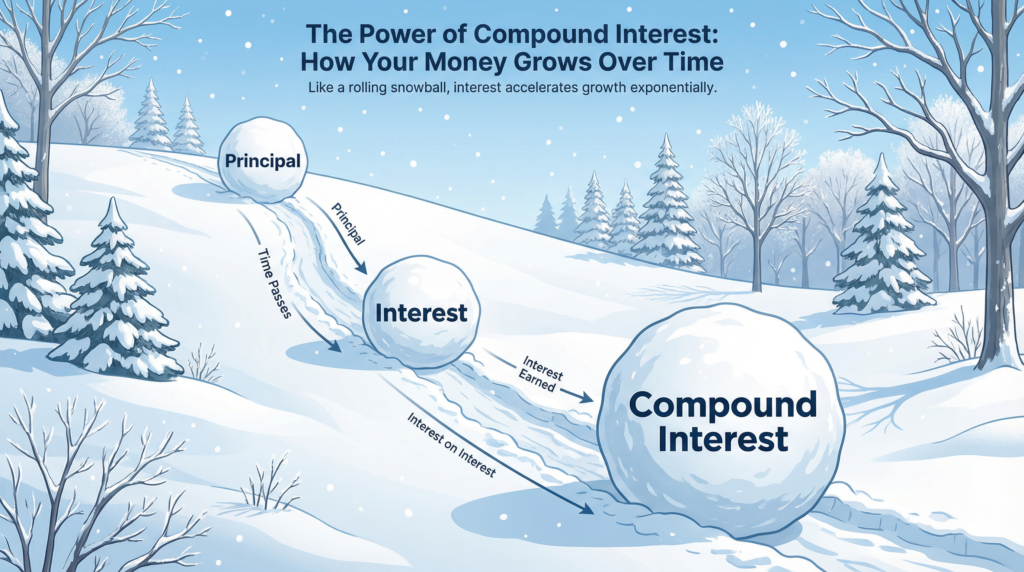
At its core, compound interest is interest calculated on both your initial principal and the accumulated interest from previous periods. Think of it as “interest on interest”—your money earns returns, and then those returns start earning their own returns.
To understand how compound interest works conceptually, imagine planting a tree that produces fruit. The first year, you get some fruit from your tree. But if you plant the seeds from that fruit, you’ll have more trees the next year. Each new tree produces its own fruit, which can be planted to create even more trees. Your orchard grows not just from your original tree, but from all the subsequent trees it helped create.
The three core elements involved in compound interest are:
- Principal: Your initial investment or deposit amount
- Interest Rate: The percentage return your money earns per period
- Time: The duration your money compounds (and the frequency of compounding)
Unlike simple interest, which only calculates returns on your original principal, compound interest recalculates based on your growing balance. This creates a snowball effect that becomes increasingly powerful over time.
How Is Compound Interest Calculated Step by Step?
Understanding how compound interest works mathematically helps demystify its power. The standard compound interest formula is:
A = P(1 + r/n)^(nt)
Where:
- A = Final amount
- P = Principal (initial amount)
- r = Annual interest rate (as a decimal)
- n = Number of times interest compounds per year
- t = Number of years
Let’s break down each component and see how compound interest works with a practical example.
Step-by-Step Calculation Example
Suppose you invest $1,000 at a 6% annual interest rate, compounded annually, for 3 years.
Year 1:
- Starting balance: $1,000
- Interest earned: $1,000 × 0.06 = $60
- Ending balance: $1,060
Year 2:
- Starting balance: $1,060 (note: not $1,000!)
- Interest earned: $1,060 × 0.06 = $63.60
- Ending balance: $1,123.60
Year 3:
- Starting balance: $1,123.60
- Interest earned: $1,123.60 × 0.06 = $67.42
- Ending balance: $1,191.02
Using the formula: A = 1000(1 + 0.06/1)^(1×3) = 1000(1.06)³ = $1,191.02
Comparison: Compound vs. Simple Interest
| Year | Simple Interest Balance | Compound Interest Balance | Difference |
|---|---|---|---|
| 0 | $1,000.00 | $1,000.00 | $0.00 |
| 1 | $1,060.00 | $1,060.00 | $0.00 |
| 2 | $1,120.00 | $1,123.60 | $3.60 |
| 3 | $1,180.00 | $1,191.02 | $11.02 |
| 5 | $1,300.00 | $1,338.23 | $38.23 |
| 10 | $1,600.00 | $1,790.85 | $190.85 |
This table illustrates how compound interest works differently from simple interest, creating an expanding gap over time.
Why Does Compound Interest Grow Slowly at First and Faster Later?
One of the most important aspects of understanding how compound interest works is recognizing its growth pattern: slow at the beginning, explosive toward the end.
Early-Stage vs. Late-Stage Growth
In the early years of compounding, growth appears modest because you’re earning returns primarily on your initial principal. However, as time progresses, you’re earning returns on an increasingly larger base that includes all your accumulated interest.
Let’s examine a $10,000 investment at 8% annual interest:
| Time Period | Starting Balance | Interest Earned | Ending Balance | Growth Rate |
|---|---|---|---|---|
| Year 1 | $10,000 | $800 | $10,800 | 8.0% |
| Year 10 | $20,990 | $1,679 | $22,669 | 8.0% |
| Year 20 | $45,042 | $3,603 | $48,645 | 8.0% |
| Year 30 | $96,662 | $7,733 | $104,395 | 8.0% |
Notice that while the percentage rate stays constant at 8%, the absolute dollar growth accelerates dramatically. By year 30, you’re earning $7,733 in a single year—more than you’ve invested in total after 10 years.
The Compounding Momentum Explained
This acceleration happens because of what’s called the exponential effect. Each compounding period creates a slightly larger base for the next period. Early on, these increases are small. But as they accumulate, they create momentum. Think of it like pushing a flywheel—it’s hard to get moving initially, but once it’s spinning, it takes on a life of its own.
The mathematical reason why compound interest works this way is that you’re multiplying by a growth factor repeatedly. With an 8% rate, you multiply by 1.08 each year. The first multiplication (1 × 1.08) gives you 1.08. But by the 30th multiplication, you’re at 10.06—your money has grown tenfold.
The Rule of 72
A quick way to understand compounding speed is the Rule of 72: divide 72 by your interest rate to estimate how many years it takes to double your money.
- At 6% annual return: 72 ÷ 6 = 12 years to double
- At 8% annual return: 72 ÷ 8 = 9 years to double
- At 12% annual return: 72 ÷ 12 = 6 years to double
How Does Compounding Frequency Change the Final Amount?
Understanding how compound interest works requires examining how often interest is calculated and added to your balance. The frequency of compounding—whether annually, quarterly, monthly, or daily—significantly impacts your final returns.
The Mathematical Impact of Frequency
When interest compounds more frequently, you earn “interest on interest” more often throughout the year. Even though the annual rate stays the same, more frequent compounding creates additional growth opportunities.
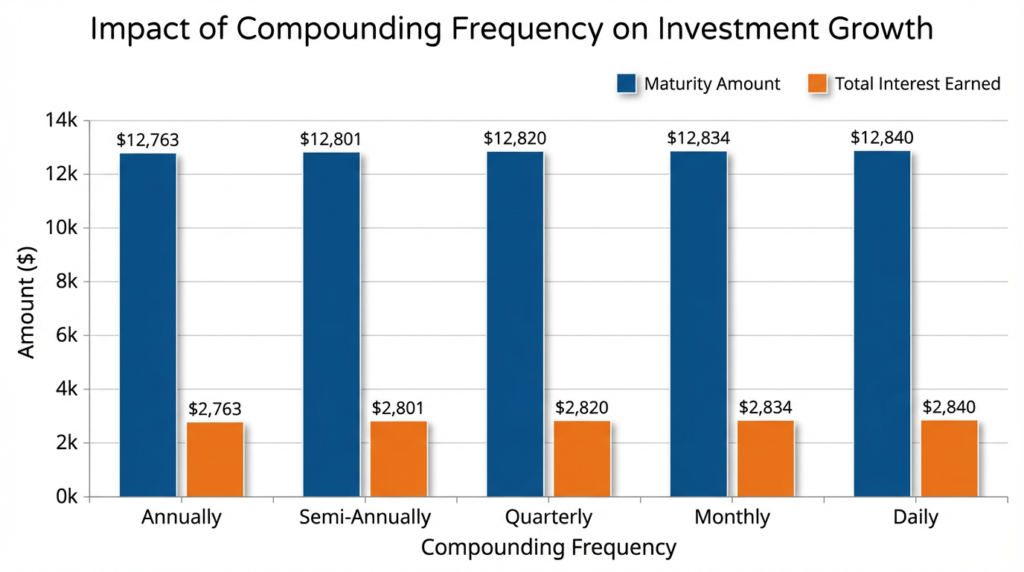
Let’s see how compound interest works with different compounding frequencies using a $10,000 investment at 6% annual interest over 10 years:
| Compounding Frequency | Compounds Per Year (n) | Final Amount | Total Interest Earned |
|---|---|---|---|
| Annually | 1 | $17,908.48 | $7,908.48 |
| Semi-Annually | 2 | $17,959.63 | $7,959.63 |
| Quarterly | 4 | $18,061.11 | $8,061.11 |
| Monthly | 12 | $18,166.97 | $8,166.97 |
| Daily | 365 | $18,220.89 | $8,220.89 |
The difference between annual and daily compounding is $312.41—a 3.9% increase in total interest earned, just from compounding more frequently.
Why Frequency Accelerates Growth
Each time interest compounds, it gets added to your principal balance. With more frequent compounding, this happens more often, giving your “interest on interest” more opportunities to accumulate.
Here’s how compound interest works over the course of one year with $1,000 at 12% interest:
Annual Compounding:
- End of year: $1,000 × 1.12 = $1,120.00
Monthly Compounding:
- Each month: Previous balance × 1.01 (12% ÷ 12 months)
- End of year: $1,000 × (1.01)^12 = $1,126.83
The $6.83 difference comes from the fact that with monthly compounding, your interest from earlier months starts earning its own interest before the year ends.
The Limit of Compounding Frequency
As compounding frequency increases toward infinity, returns approach a mathematical limit called continuous compounding (which we’ll explore in detail later). The practical takeaway is that while more frequent compounding is better, the gains diminish as frequency increases—the jump from annual to monthly is more significant than the jump from monthly to daily.
How Does Compound Interest Work in Savings Accounts?
Savings accounts are one of the most common places where people experience the practical application of compound interest. Banks apply compound interest to help your deposits grow over time, though the mechanics vary slightly by institution.
How Banks Apply Compounding
Most savings accounts compound interest daily or monthly, then credit it to your account monthly or quarterly. Here’s the typical process:
- Daily Calculation: The bank calculates interest on your daily balance
- Monthly Accumulation: These daily interest amounts accumulate throughout the month
- Monthly/Quarterly Credit: The total accumulated interest is added to your account balance
- New Base: Your new balance (including the credited interest) becomes the base for future calculations
Interest Credit Cycles
Understanding how compound interest works in savings accounts requires knowing when interest is actually added to your balance. For example:
Scenario: $5,000 in a savings account with 2% APY (Annual Percentage Yield), compounded daily, credited monthly
- Daily interest rate: 2% ÷ 365 = 0.00548%
- Day 1 interest: $5,000 × 0.0000548 = $0.274
- Day 2 interest: $5,000.274 × 0.0000548 = $0.274
- After 30 days: approximately $8.22 in accumulated interest
- Month-end: $8.22 credited to account, new balance: $5,008.22
Balance Growth Mechanics Over Time
| Month | Starting Balance | Interest Earned | Ending Balance |
|---|---|---|---|
| 1 | $5,000.00 | $8.22 | $5,008.22 |
| 6 | $5,049.84 | $8.30 | $5,058.14 |
| 12 | $5,100.50 | $8.38 | $5,108.88 |
| 24 | $5,209.92 | $8.56 | $5,218.48 |
This demonstrates how compound interest works gradually in a savings environment, with each month’s interest becoming part of the principal for subsequent calculations.
APY vs. APR: Understanding the Difference
Banks advertise APY (Annual Percentage Yield) rather than APR (Annual Percentage Rate) for savings accounts because APY reflects how compound interest works—it includes the effect of compounding. An account with 2% APR compounded monthly has an APY of approximately 2.02%, reflecting the actual return you’ll earn after compounding effects.
Can Compound Interest Work Against You?
While we typically discuss compound interest in the context of growing wealth, it’s crucial to understand how compound interest works when you’re on the borrowing side of the equation. In these cases, compounding becomes a powerful force working against your financial interests.
Compounding in Liabilities
When you carry debt—particularly credit card balances—compound interest works in reverse. Instead of earning interest on interest, you’re paying interest on interest, causing your debt to grow exponentially if left unchecked.
Why Balances Can Escalate
Credit card debt provides the clearest example of how compound interest works against borrowers. Most credit cards compound daily and have annual percentage rates (APRs) between 15% and 25%.
Example: $5,000 credit card balance at 18% APR, making only minimum payments
| Month | Starting Balance | Interest Charged | Payment | Ending Balance |
|---|---|---|---|---|
| 1 | $5,000.00 | $75.00 | $100.00 | $4,975.00 |
| 6 | $4,624.84 | $69.37 | $100.00 | $4,594.21 |
| 12 | $4,194.28 | $62.91 | $100.00 | $4,157.19 |
| 24 | $3,256.69 | $48.85 | $100.00 | $3,205.54 |
If you only pay the minimum payment each month, it would take approximately 7 years to pay off the original $5,000 balance, and you’d pay roughly $3,200 in interest—nearly 64% of the original balance.
Structural Reasons Behind Negative Compounding
Understanding how compound interest works on debt reveals why it’s so insidious:
- Daily Compounding: Most credit cards compound daily, giving interest charges 365 opportunities per year to increase your balance
- High Rates: Credit card APRs are typically much higher than investment returns
- Minimum Payments: These are structured to barely exceed interest charges, keeping you in debt longer
- Snowball Effect: As interest compounds, a larger portion of your payment goes toward interest rather than principal
The Cost Comparison
Here’s how compound interest works differently on identical amounts:
| Scenario | Type | Rate | 10-Year Outcome |
|---|---|---|---|
| $10,000 investment | Savings/Investment | 6% | $18,194 (gain of $8,194) |
| $10,000 debt | Credit Card | 18% | $52,338 total paid (cost of $42,338) |
This stark contrast shows that the same mathematical principle working for you in investments works with much greater force against you in high-interest debt.
7. How Can Compound Interest Be Explained Using Graphs?
Visual representations are often the most effective way to understand how compound interest works, particularly its exponential growth pattern that can be difficult to grasp from numbers alone.
Growth Curve Interpretation
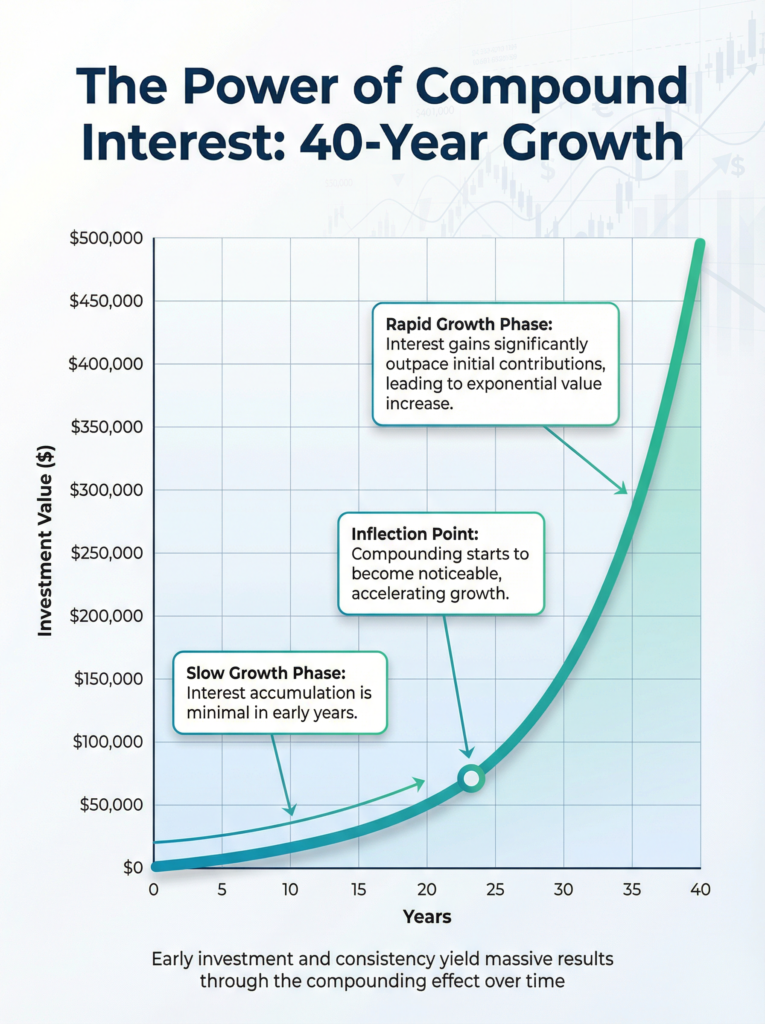
The compound interest growth curve follows a distinctive J-shape or exponential curve pattern. Initially, the line appears relatively flat, showing modest growth. As time progresses, the curve becomes steeper until it shoots upward dramatically in later periods.
Key features of the compound interest growth curve:
- Flat beginning: The early years show gradual, almost linear growth
- Inflection point: A point where growth noticeably accelerates
- Steep ascent: Later years, where growth becomes dramatically vertical
Flat vs. Steep Compounding Phases
Let’s examine how compound interest works visually with a $10,000 investment at 8% over 40 years:
| Year | Balance | 5-Year Growth | Growth Acceleration |
|---|---|---|---|
| 5 | $14,693 | $4,693 | Baseline |
| 10 | $21,589 | $6,896 | 1.47× faster |
| 20 | $46,610 | $24,021 | 5.12× faster |
| 30 | $100,627 | $54,017 | 11.51× faster |
| 40 | $217,245 | $116,618 | 24.85× faster |
The graph showing this data would display a relatively flat line for the first 10-15 years, a gentle upward curve through years 15-25, and then a nearly vertical climb in the final 15 years.
Why Visuals Clarify Compounding Behavior
Graphs make it immediately obvious how compound interest works over extended periods by:
- Showing the non-linear nature: Unlike simple interest (which graphs as a straight line), compound interest curves upward
- Illustrating the time value: The visual gap between starting and ending values emphasizes why starting early matters
- Comparing scenarios: Multiple lines on one graph can show different rates, frequencies, or starting amounts
Multiple Scenario Comparison
A particularly instructive visualization shows how compound interest works under different conditions:
| Years | 4% Return | 8% Return | 12% Return |
|---|---|---|---|
| 10 | $14,802 | $21,589 | $31,058 |
| 20 | $21,911 | $46,610 | $96,463 |
| 30 | $32,434 | $100,627 | $299,599 |
| 40 | $48,010 | $217,245 | $930,510 |
When graphed, these three lines start together at $10,000 but diverge dramatically over time, with the 12% line reaching nearly $1 million while the 4% line barely exceeds $48,000—a stunning visual representation of how rate differences compound.
What Is Continuous Compounding and How Does It Work?
To fully understand how compound interest works, we need to explore its theoretical limit: continuous compounding. This concept represents what happens when compounding frequency approaches infinity.
Concept of Continuous Compounding
Continuous compounding assumes that interest is calculated and added to the principal constantly—every instant, rather than annually, monthly, or even daily. While purely theoretical (no bank actually compounds continuously), this concept represents the mathematical upper bound of how compound interest works.
Mathematical Explanation
The continuous compounding formula uses the mathematical constant e (approximately 2.71828):
A = Pe^(rt)
Where:
- A = Final amount
- P = Principal
- e = Euler’s number (2.71828…)
- r = Annual interest rate (as a decimal)
- t = Time in years
Let’s see how compound interest works with continuous compounding versus other frequencies:
Example: $10,000 at 6% for 10 years
| Compounding Type | Formula | Final Amount |
|---|---|---|
| Annual | $10,000(1.06)^10 | $17,908.48 |
| Monthly | $10,000(1.005)^120 | $18,166.97 |
| Daily | $10,000(1 + 0.06/365)^3650 | $18,220.89 |
| Continuous | $10,000e^(0.6) | $18,221.18 |
How It Differs from Periodic Compounding
The key difference in how compound interest works with continuous compounding is that there are no discrete compounding periods. The formula calculates growth as if interest is being added at every infinitesimally small moment in time.
Practical applications of continuous compounding:
- Theoretical modeling: Used in financial mathematics and option pricing
- Natural processes: Model population growth, radioactive decay, and other continuous processes
- Maximum return calculation: Helps determine the absolute ceiling of returns at a given rate
The Convergence to e
An interesting mathematical property shows how compound interest works as frequency increases. Starting with $1 at 100% interest:
| Compounding Frequency | Compounds (n) | Result |
|---|---|---|
| Annual | 1 | $2.00 |
| Semi-annual | 2 | $2.25 |
| Quarterly | 4 | $2.44 |
| Monthly | 12 | $2.61 |
| Daily | 365 | $2.7146 |
| Hourly | 8,760 | $2.7181 |
| Continuous | ∞ | $2.71828… (e) |
This convergence to Euler’s number demonstrates a fundamental truth about how compound interest works at its theoretical maximum.
How Does Compound Interest Actually Work?
Consolidated Explanation
Compound interest works by calculating interest not only on your initial principal but also on all the interest that has accumulated in previous periods. This creates a snowball effect where your money grows exponentially rather than linearly over time.
Step-by-Step Logical Flow
Step 1: Initial Deposit or Investment You place money into an account or investment that pays compound interest—this is your principal.
Step 2: First Interest Calculation. At the end of the first compounding period (which could be daily, monthly, quarterly, or annually), interest is calculated on your principal and added to your balance.
Step 3: Compounding Begins. In the second period, interest is calculated on your original principal plus the interest you earned in the first period. Your balance has grown, so you earn more interest.
Step 4: Acceleration Over Time. This process repeats with each compounding period. As your balance grows, each interest payment becomes larger, which further increases your balance, which generates even larger interest payments.
Step 5: Exponential Growth Over many years, this compounding effect becomes dramatic. The interest you earn on previously earned interest can eventually exceed the interest earned on your original principal.
Summary of the Compounding Process
Here’s a practical example showing how compound interest works with a $1,000 deposit at 5% annual interest:
| Period | Starting Balance | Interest Earned | Ending Balance | Growth Source |
|---|---|---|---|---|
| Year 1 | $1,000.00 | $50.00 | $1,050.00 | 100% from principal |
| Year 2 | $1,050.00 | $52.50 | $1,102.50 | 95% principal, 5% compound |
| Year 5 | $1,215.51 | $60.78 | $1,276.28 | 82% principal, 18% compound |
| Year 10 | $1,551.33 | $77.57 | $1,628.89 | 64% principal, 36% compound |
| Year 20 | $2,526.95 | $126.35 | $2,653.30 | 39% principal, 61% compound |
By year 20, more than 60% of your growth comes from compound interest rather than interest on your original $1,000 principal.
The Three Key Factors
How compound interest works depends on three primary variables:
- Time: The longer money compounds, the more dramatic the growth
- Rate: Higher interest rates produce faster exponential growth
- Frequency: More frequent compounding creates additional growth opportunities
How Compound Interest Works in Mutual Funds
Mutual funds offer a sophisticated environment to observe how compound interest works through market returns rather than fixed interest rates. The compounding mechanism in mutual funds operates through reinvested gains and NAV growth.
NAV Growth and Reinvestment
A mutual fund’s Net Asset Value (NAV) represents the per-share value of the fund. Understanding how compound interest works in mutual funds requires recognizing that growth comes from two sources:
- Capital appreciation: The underlying securities increase in value
- Dividend/interest distributions: Income generated by the fund’s holdings
When you choose to reinvest distributions (rather than taking them as cash), you purchase additional shares at the current NAV. These additional shares then participate in all future growth, creating a compounding effect.
Compounding Through Returns
Here’s how compound interest works in a mutual fund with an average 8% annual return and dividend reinvestment:
Initial investment: $10,000
| Year | Starting Value | Return (8%) | Dividends Paid | Shares Owned | NAV | Ending Value |
|---|---|---|---|---|---|---|
| 1 | $10,000 | $800 | $200 (2%) | 105.88 | $102.00 | $10,800 |
| 5 | $13,982 | $1,119 | $280 | 129.23 | $114.05 | $14,739 |
| 10 | $20,106 | $1,608 | $402 | 165.32 | $126.89 | $20,979 |
| 20 | $43,219 | $3,458 | $864 | 330.56 | $135.42 | $44,762 |
The compounding happens through two mechanisms:
- Share accumulation through reinvested dividends
- NAV growth on an increasing number of shares
Time-Based Accumulation
One critical aspect of how compound interest works in mutual funds is that market volatility doesn’t prevent long-term compounding—it can actually enhance it through a concept called rupee-cost averaging when combined with regular investments.
| Investment Period | Market Performance | Cumulative Return Impact |
|---|---|---|
| Years 1-5 | Volatile, average 8% | Modest compounding |
| Years 6-15 | Strong bull market | Accelerated compounding |
| Years 16-20 | Mixed conditions | Compounding on a larger base |
| Overall | Average 8% annually | Exponential final value |
The key advantage is that dividends reinvested during market downturns purchase more shares at lower prices, which then benefit when markets recover—demonstrating how compound interest works even through market cycles.
How Compound Interest Works in SIP (Systematic Investment Plans)
Systematic Investment Plans (SIPs) provide one of the most powerful demonstrations of how compound interest works when combined with regular, disciplined investing. Unlike lump-sum investments, SIPs involve periodic contributions that each have their own compounding timeline.
Periodic Contributions
With a SIP, you invest a fixed amount at regular intervals (typically monthly). Each contribution starts its own compounding journey from the moment it’s invested, creating multiple layers of compounding happening simultaneously.
Example: Monthly SIP of $500 at 10% annual return
| Month | New Investment | Previous Investments Value | Total Portfolio Value |
|---|---|---|---|
| 1 | $500 | $0 | $500 |
| 6 | $500 | $2,570 | $3,070 |
| 12 | $500 | $6,310 | $6,810 |
| 24 | $500 | $14,952 | $15,452 |
| 60 | $500 | $45,736 | $46,236 |
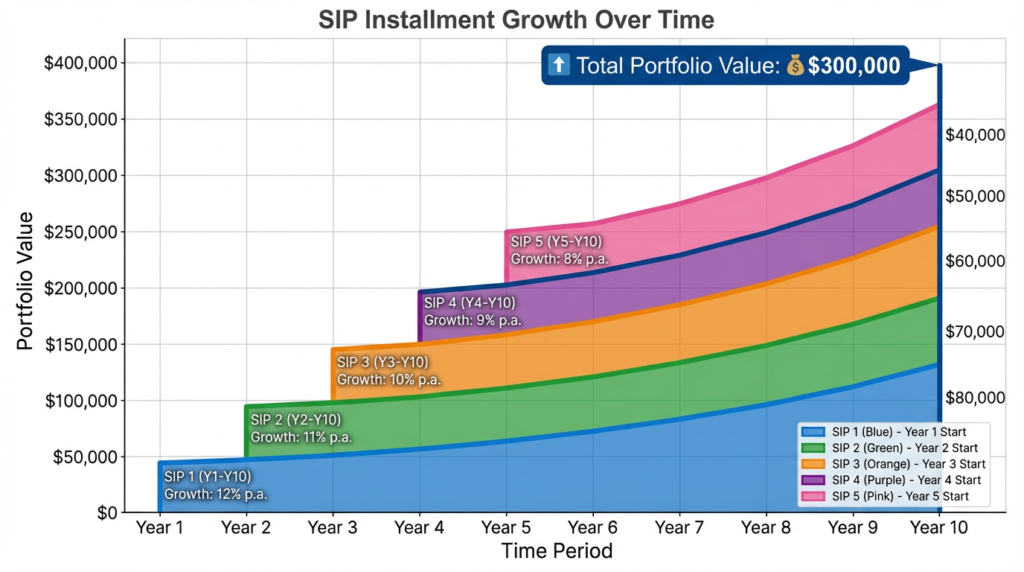
Compounding Across Installments
Understanding how compound interest works in SIPs requires visualizing each installment as having a different maturity period:
$500 monthly SIP for 10 years at 10% annual return:
| Installment | Month Invested | Time Compounding | Value at Year 10 |
|---|---|---|---|
| First | Month 1 | 120 months | $1,317.09 |
| 12th | Month 12 | 108 months | $1,177.12 |
| 60th | Month 60 | 60 months | $815.47 |
| 120th | Month 120 | 0 months | $500.00 |
Your first $500 has 10 full years to compound, while your last $500 has no time to compound at all. This staggered compounding is what makes how compound interest works in SIPs unique.
Long-Term Accumulation Mechanism
The real power emerges over extended periods:
| Investment Period | Total Invested | Portfolio Value | Returns Earned | Compound Effect |
|---|---|---|---|---|
| 5 years | $30,000 | $38,728 | $8,728 | 29.1% |
| 10 years | $60,000 | $102,422 | $42,422 | 70.7% |
| 15 years | $90,000 | $206,357 | $116,357 | 129.3% |
| 20 years | $120,000 | $379,684 | $259,684 | 216.4% |
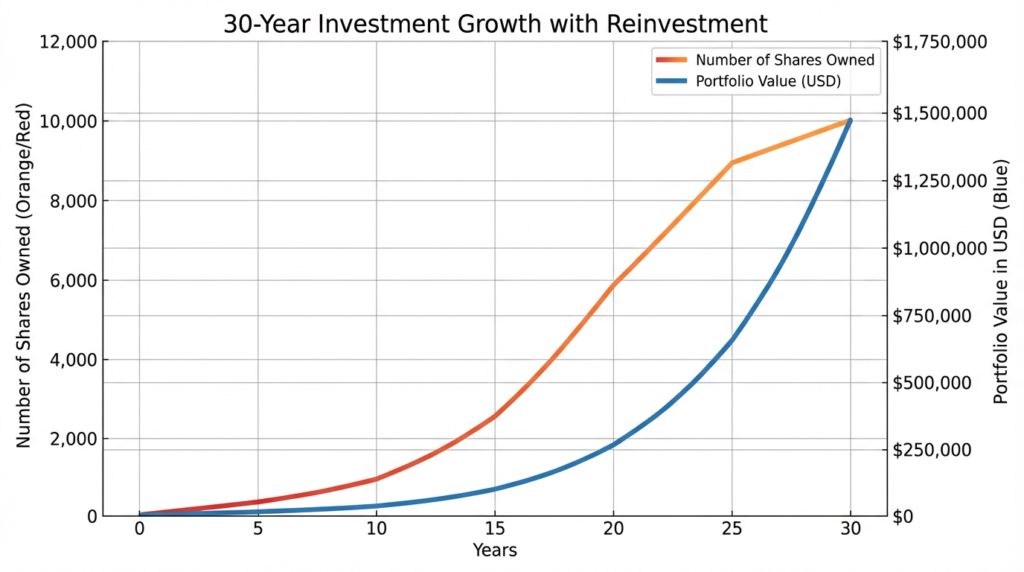
| 30 years | $180,000 | $1,130,259 | $950,259 | 527.9% |
Notice that by year 30, your returns ($950,259) are more than 5 times your total contributions ($180,000)—this demonstrates how compound interest works when given sufficient time.
The SIP Advantage During Volatility
One unique aspect of how compound interest works in SIPs is the benefit during market downturns:
- Down markets: Your fixed investment buys more units at lower prices
- Recovery: Those additional units participate in the full upside
- Result: Enhanced compounding compared to lump-sum investing
How Compound Interest Works in FD (Fixed Deposits)
Fixed deposits represent one of the most straightforward applications of how compound interest works, with predictable returns and clear compounding mechanisms. Unlike market-linked investments, FDs offer guaranteed returns that compound in a structured manner.
Interest Reinvestment Cycles
In a fixed deposit, you have typically two options:
- Cumulative FD: Interest is compounded and reinvested
- Non-cumulative FD: Interest is paid out periodically
Understanding how compound interest works requires choosing the cumulative option, where interest accrues and compounds according to the bank’s schedule.
Compounding Intervals
Banks offer various compounding frequencies for FDs:
Example: $100,000 FD at 7% annual interest for 5 years
| Compounding Frequency | Number of Compounds | Maturity Value | Total Interest |
|---|---|---|---|
| Annually | 5 | $140,255.17 | $40,255.17 |
| Half-Yearly | 10 | $141,060.07 | $41,060.07 |
| Quarterly | 20 | $141,478.34 | $41,478.34 |
| Monthly | 60 | $141,788.40 | $41,788.40 |
The difference between annual and monthly compounding is $1,533.23—demonstrating how compound interest works more effectively with frequent compounding intervals.
Maturity Value Formation
Here’s how compound interest works in a 5-year FD with quarterly compounding:
$100,000 at 7% compounded quarterly
| Quarter | Starting Balance | Interest Earned | Ending Balance |
|---|---|---|---|
| 1 | $100,000.00 | $1,750.00 | $101,750.00 |
| 4 | $107,185.90 | $1,875.75 | $109,061.65 |
| 8 | $114,888.37 | $2,010.55 | $116,898.92 |
| 12 | $123,144.21 | $2,155.02 | $125,299.23 |
| 16 | $132,003.80 | $2,310.07 | $134,313.87 |
| 20 | $141,478.34 | $2,475.87 | $143,954.21 |
Each quarter, the interest earned joins the principal, creating a larger base for the next quarter’s calculation—the essence of how compound interest works.
Comparing FD Tenures
| FD Duration | Principal | Rate | Maturity Value | Effective Annual Return |
|---|---|---|---|---|
| 1 year | $100,000 | 6.5% | $106,697 | 6.697% |
| 3 years | $100,000 | 7.0% | $123,144 | 7.183% |
| 5 years | $100,000 | 7.25% | $142,331 | 7.314% |
| 10 years | $100,000 | 7.5% | $209,378 | 7.655% |
Longer tenures allow more time for compounding to work, which is why the effective annual return exceeds the nominal rate more significantly in longer-term deposits.
How Compound Interest Works in Stocks (Part 1: Retained Earnings)
Stocks offer a unique environment to observe how compound interest works through business growth and value creation rather than explicit interest payments. The compounding mechanism operates through retained earnings that fuel business expansion.
Compounding via Retained Earnings
When a company earns profits, it has two choices: distribute them as dividends or retain them for growth. Retained earnings represent reinvested capital that works similarly to how compound interest works in traditional investments.
The retained earnings compounding cycle:
- The company earns profit
- Retains portion of earnings
- Reinvests in business expansion
- Generates additional future profits
- Cycle repeats with a larger earnings base
Price Appreciation Over Time
Companies that consistently reinvest earnings typically demonstrate how compound interest works through stock price appreciation:
Hypothetical example: Growth company with 15% annual earnings growth, 80% retention ratio
| Year | Earnings Per Share | Retained Earnings | Stock Price | % Price Increase |
|---|---|---|---|---|
| 0 | $1.00 | N/A | $20.00 | N/A |
| 5 | $2.01 | $8.05 cumulative | $40.20 | 101% |
| 10 | $4.05 | $32.38 cumulative | $81.00 | 305% |
| 15 | $8.14 | $129.92 cumulative | $162.80 | 714% |
| 20 | $16.37 | $520.75 cumulative | $327.40 | 1,537% |
Reinvestment-Driven Growth
Understanding how compound interest works in this context requires recognizing that each dollar of retained earnings ideally generates additional future earnings:
Company with 20% return on equity (ROE) and 75% earnings retention:
| Metric | Year 1 | Year 5 | Year 10 | Year 20 |
|---|---|---|---|---|
| Beginning equity | $100M | $207M | $516M | $3,257M |
| Earnings (20% ROE) | $20M | $41M | $103M | $651M |
| Retained (75%) | $15M | $31M | $77M | $488M |
| Ending equity | $115M | $238M | $593M | $3,745M |
The company’s equity base compounds annually through retained earnings, which then generates progressively larger profits—demonstrating exactly how compound interest works in a business context.
The Buffett Model
Warren Buffett famously illustrated how compound interest works through retained earnings with his “$1 test”: a dollar of retained earnings should create at least one dollar of market value. Companies that reinvest effectively can turn each dollar into more than a dollar of shareholder value over time.
How Compound Interest Works in Stocks (Part 2: Dividends)
While the previous section examined how compound interest works through retained earnings, this section focuses on dividend reinvestment—another powerful compounding mechanism in stock investing.
Compounding Through Dividends
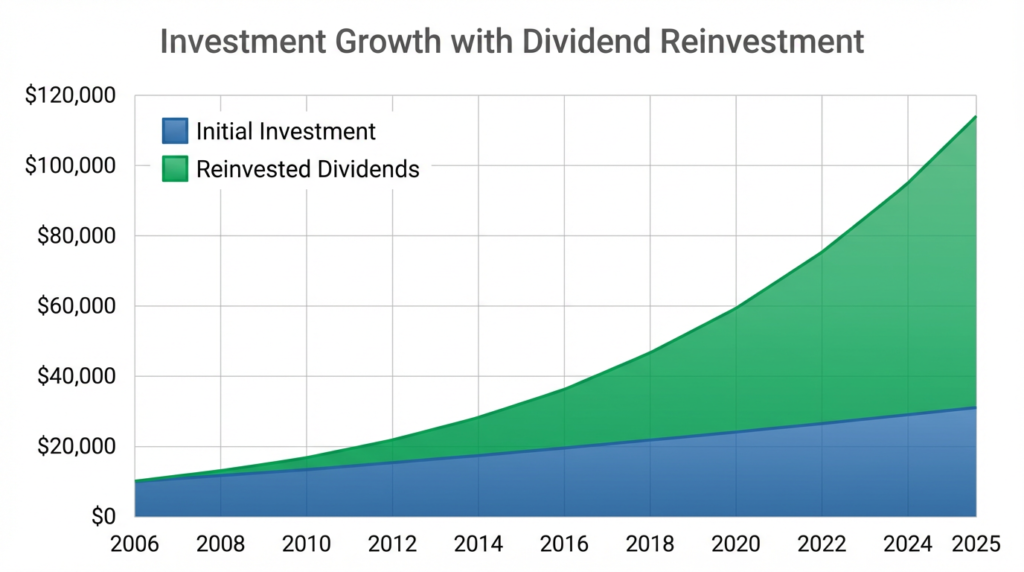
When companies pay dividends, and investors reinvest them to purchase additional shares, they create a compounding effect similar to interest reinvestment in savings accounts. Each reinvested dividend buys more shares, which generate their own dividends, creating an expanding base of income-producing assets.
Reinvestment Effect
Here’s how compound interest works with dividend reinvestment, using a stock initially priced at $50 with a 3% dividend yield and 6% annual price appreciation:
Initial investment: $10,000 (200 shares)
| Year | Share Price | Shares Owned | Annual Dividend | Dividend Reinvested | Portfolio Value |
|---|---|---|---|---|---|
| 0 | $50.00 | 200.00 | $0 | N/A | $10,000 |
| 5 | $66.91 | 234.26 | $702.78 | $702.78 | $15,674 |
| 10 | $89.54 | 274.54 | $820.62 | $820.62 | $24,577 |
| 15 | $119.87 | 321.60 | $964.80 | $964.80 | $38,551 |
| 20 | $160.36 | 376.65 | $1,129.95 | $1,129.95 | $60,397 |
| 25 | $214.59 | 441.01 | $1,323.03 | $1,323.03 | $94,652 |
Without dividend reinvestment, the same investment would be worth only $71,434 after 25 years. The additional $23,218 comes from how compound interest works through reinvested dividends.
Long-Term Value Creation
The true power of how compound interest works with dividend reinvestment becomes apparent when we break down the sources of returns:
| Period | Price Appreciation | Dividend Income | Compounding Effect | Total Return |
|---|---|---|---|---|
| Years 1-5 | $3,382 | $1,892 | $400 | $5,674 (57%) |
| Years 6-10 | $4,485 | $2,894 | $1,524 | $8,903 (57%) |
| Years 11-15 | $5,965 | $4,016 | $2,993 | $13,974 (57%) |
| Years 16-20 | $7,927 | $5,574 | $5,345 | $18,846 (31%) |
| Years 21-25 | $10,536 | $7,734 | $9,985 | $28,255 (47%) |
By years 21-25, the compounding effect (returns generated on previously reinvested dividends) contributes more than price appreciation or current dividend income alone.
The Dividend Growth Advantage
An even more powerful demonstration of how compound interest works combines dividend reinvestment with dividend growth:
$10,000 in a dividend growth stock: 3% initial yield, 7% dividend growth, 8% price appreciation
| Year | Annual Dividend Per Share | Total Annual Dividend | Shares Owned | Portfolio Value |
|---|---|---|---|---|
| 5 | $2.10 | $564 | 268.42 | $20,164 |
| 10 | $2.95 | $1,042 | 353.41 | $40,455 |
| 15 | $4.14 | $1,924 | 464.96 | $81,164 |
| 20 | $5.81 | $3,555 | 611.68 | $162,800 |
| 30 | $11.45 | $12,775 | 1,115.88 | $586,242 |
The combination of reinvestment and growing dividends creates an acceleration effect that dramatically demonstrates how compound interest works over extended periods.
How Compound Interest Works in Investing
Beyond specific investment vehicles, understanding how compound interest works at the portfolio level helps investors maximize wealth creation across all their holdings. The principles remain consistent, but portfolio-level compounding involves additional considerations.
Portfolio-Level Compounding
When managing a diversified investment portfolio, compound interest works through the collective growth of all assets, with returns from each component contributing to the compounding base:
Diversified portfolio composition and compounding:
| Asset Class | Allocation | Average Return | 20-Year Value of $100K |
|---|---|---|---|
| Stocks | 60% | 9% | $336,375 |
| Bonds | 30% | 5% | $79,599 |
| Real Estate | 10% | 7% | $38,697 |
| Total Portfolio | 100% | ~7.8% | $454,671 |
The portfolio compounds as a unified whole, with each asset class contributing proportionally to overall growth.
Reinvested Gains
A critical aspect of how compound interest works in investing is the discipline of reinvesting all forms of returns:
- Dividends: Instead of spending, purchase more shares
- Interest: Reinvest rather than withdraw
- Capital gains: When selling positions, redeploy proceeds
- Rebalancing proceeds: Maintain target allocations
Impact of reinvestment over 30 years with a $50,000 initial investment at 8% average return:
| Reinvestment Strategy | Final Portfolio Value | Total Withdrawn | Net Worth Impact |
|---|---|---|---|
| Full reinvestment | $503,133 | $0 | $503,133 |
| Withdraw 2% annually | $312,844 | $95,420 | $408,264 |
| Withdraw 4% annually | $194,429 | $191,573 | $386,002 |
Withdrawing even modest amounts significantly reduces how compound interest works to build wealth.
Time as a Multiplier
Time is perhaps the most powerful factor in how compound interest works for long-term investors:
The same $10,000 annual contribution at 8% return:
| Investment Period | Total Contributions | Portfolio Value | Return Multiple |
|---|---|---|---|
| 10 years | $100,000 | $156,455 | 1.56× |
| 20 years | $200,000 | $494,229 | 2.47× |
| 30 years | $300,000 | $1,223,459 | 4.08× |
| 40 years | $400,000 | $2,797,781 | 6.99× |
Doubling the investment period from 20 to 40 years more than quintuples the final value—this non-linear relationship illustrates exactly how compound interest works over extended timeframes.
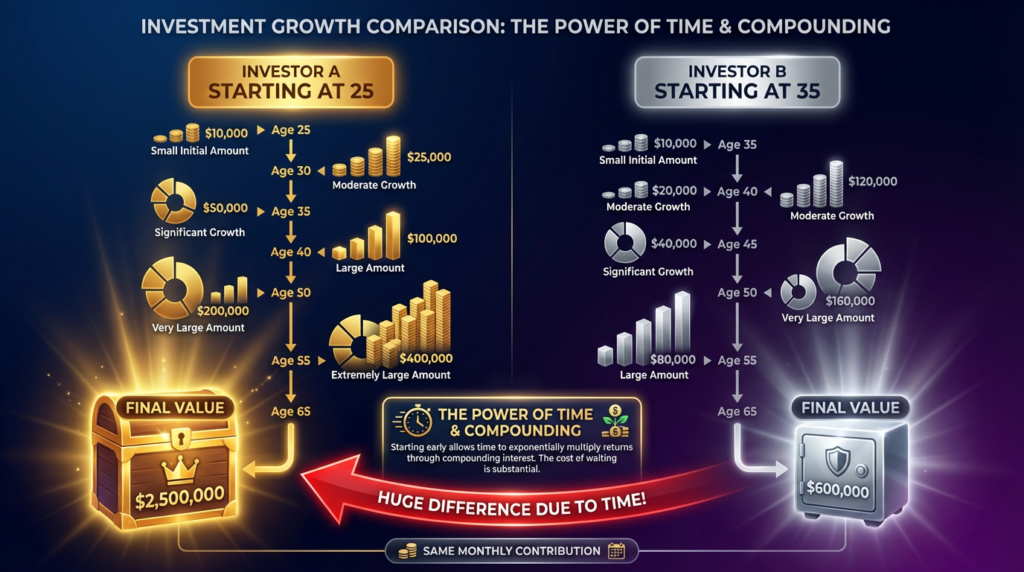
The Early Start Advantage
One of the most dramatic demonstrations of how compound interest works is comparing early versus late investing starts:
| Investor | Investment Period | Monthly Contribution | Total Invested | Value at Age 65 |
|---|---|---|---|---|
| Early Start | Age 25-35 (10 years) | $500 | $60,000 | $1,142,811 |
| Late Start | Age 35-65 (30 years) | $500 | $180,000 | $745,179 |
The early starter invests $120,000 less but ends with $397,632 more, purely because of how compound interest works when given additional time.
How Compound Interest Works in 401(k) Plans
401(k) retirement accounts provide one of the most powerful applications of how compound interest works, combining tax advantages, employer matching, and decades of compounding to build substantial retirement wealth.
Contribution Growth Structure
Understanding how compound interest works in a 401(k) requires recognizing the multiple layers of growth:
- Personal contributions: Your regular payroll deferrals
- Employer match: Additional contributions from your employer
- Investment returns: Market growth on all contributions
- Tax deferral: No taxes paid until withdrawal, allowing full amounts to compound
Example: $50,000 annual salary, 6% employee contribution, 3% employer match, 7% annual return
| Year | Employee Contribution | Employer Match | Total Annual Contribution | Account Value |
|---|---|---|---|---|
| 1 | $3,000 | $1,500 | $4,500 | $4,500 |
| 5 | $3,000 | $1,500 | $4,500 | $25,903 |
| 10 | $3,000 | $1,500 | $4,500 | $62,148 |
| 20 | $3,000 | $1,500 | $4,500 | $184,214 |
| 30 | $3,000 | $1,500 | $4,500 | $424,458 |
| 40 | $3,000 | $1,500 | $4,500 | $898,762 |
(Note: This simplified example assumes constant salary and contribution amounts)
Reinvestment and Compounding
How compound interest works in a 401(k) becomes especially powerful because:
All distributions are automatically reinvested:
- Dividends from stock holdings
- Interest from bond holdings
- Capital gains from fund rebalancing
Tax deferral magnifies compounding:
| Account Type | Pre-Tax Return | Tax Rate | After-Tax Return | 30-Year Value of $100K |
|---|---|---|---|---|
| Taxable account | 7% | 25% | ~5.25% | $374,532 |
| 401(k) (tax-deferred) | 7% | 0% during growth | 7% | $761,226 |
The 401(k) grows to more than double the taxable account value, demonstrating how compound interest works more effectively when taxes don’t reduce the compounding base annually.
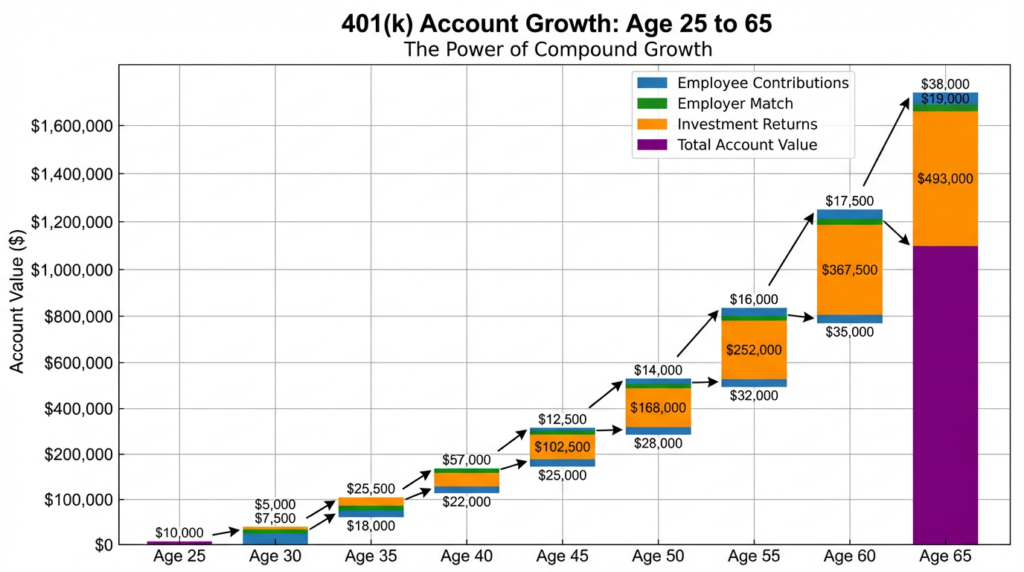
Long-Term Accumulation Mechanics
The true power of how compound interest works in a 401(k) emerges across career-spanning timelines:
Career-long 401(k) growth (ages 25-65):
| Age | Years Investing | Cumulative Contributions | Investment Returns | Account Value | Returns as % of Total |
|---|---|---|---|---|---|
| 35 | 10 | $45,000 | $17,148 | $62,148 | 28% |
| 45 | 20 | $90,000 | $94,214 | $184,214 | 51% |
| 55 | 30 | $135,000 | $289,458 | $424,458 | 68% |
| 65 | 40 | $180,000 | $718,762 | $898,762 | 80% |
By retirement, 80% of the account value comes from investment returns rather than contributions—a vivid illustration of how compound interest works to build retirement wealth.
The Cost of Delayed Participation
One of the most important lessons about how compound interest works in 401(k) plans is the opportunity cost of delayed enrollment:
| Start Age | Years Until 65 | Total Contributions | Value at 65 | Opportunity Cost vs. Age 25 Start |
|---|---|---|---|---|
| 25 | 40 | $180,000 | $898,762 | $0 (baseline) |
| 30 | 35 | $157,500 | $622,039 | $276,723 |
| 35 | 30 | $135,000 | $424,458 | $474,304 |
| 40 | 25 | $112,500 | $284,635 | $614,127 |
| 45 | 20 | $90,000 | $184,214 | $714,548 |
Delaying enrollment by just 5 years (from age 25 to 30) costs nearly $277,000 in lost retirement savings—money that can never be recovered because of how compound interest works over time.
Conclusion
Understanding how compound interest works is one of the most valuable pieces of financial knowledge you can possess. Throughout this comprehensive guide, we’ve explored how this powerful mechanism operates across different contexts—from simple savings accounts to complex investment portfolios.
Key Takeaways on Compounding Behavior
The fundamental principle remains consistent regardless of where you encounter it: compound interest calculates returns not just on your principal, but on all previously accumulated returns. This creates an exponential growth pattern that starts slowly but accelerates dramatically over time.
We’ve seen how compound interest works through:
- Mathematical precision in calculated formulas and step-by-step examples
- Frequency effects where daily compounding exceeds annual compounding
- Investment vehicles from FDs and mutual funds to stocks and 401(k) plans
- Time dynamics where early years show modest growth, but later years demonstrate explosive returns
- Both sides of the equation are building wealth through saving,s while potentially accelerating debt burdens
Why Time Amplifies Results
If there’s one lesson that should resonate from every section of this guide, it’s that time is compound interest’s most powerful amplifier. The difference between starting to invest at 25 versus 35 isn’t just 10 years—it’s potentially hundreds of thousands of dollars in lost compounding.
How compound interest works over extended periods:
- Years 1-10: Foundation building, returns modest
- Years 11-20: Acceleration begins, compounding becomes visible
- Years 21-30: Dramatic growth, returns exceed contributions
- Years 31-40: Exponential explosion, wealth multiplies rapidly
The math is unforgiving: you cannot recover lost time. Starting earlier with smaller amounts beats starting later with larger amounts nearly every time.
Final Synthesis of the Process
Compound interest represents one of the few true “forces” in personal finance—a mathematical certainty that works consistently and predictably when given three essential ingredients: principal to grow, returns to generate, and time to multiply.
Whether you’re:
- Building wealth through systematic investing in mutual funds or SIPs
- Securing retirement through 401(k) contributions that compound for decades
- Preserving capital in fixed deposits with guaranteed compounding returns
- Growing equity in stocks that reinvest earnings and compound dividends
- Managing debt by understanding how compound interest works against you in credit card balances
The principles remain the same. Master how compound interest works, apply that knowledge consistently, and let time do the heavy lifting.
The journey of a thousand miles—or in this case, the journey to financial security—begins with a single step. Understanding how compound interest works is the critical first step. The next step is action: start investing, start saving, start allowing compound interest to work in your favor.
Because while compound interest is patient, opportunity is not. The best time to start was yesterday. The second-best time is today.
FAQs
Q. What is compound interest in simple words?
- Compound interest is when interest is added to the original amount and then earns interest again, causing growth to accelerate over time.
Q. Why does compound interest grow faster over time?
- Because each compounding cycle increases the base amount, causing exponential rather than linear growth.
Q4. How is compound interest different from simple interest?
- Simple interest applies only to the original amount, while compound interest applies to both the original amount and previously earned interest.
Q5. How does compounding frequency affect growth?
- More frequent compounding (monthly or daily) increases the final amount compared to annual compounding.

Abhishek Kandir is the founder and lead writer at Paisewaise, a personal
finance publication covering Indian markets, budgeting, and investing since 2023.
Abhishek’s work focuses on making complex financial topics — from RBI
Interventions to SIP strategies — understandable for everyday Indian readers
without a financial background.
")
Amazing breakdown — the numbered steps made it easy to follow.
[…] The biggest ways people save money aren’t dramatic sacrifices. They’re tiny default behaviors that compound. […]