
How the Stock Market Works: A Beginner’s Guide (U.S. Market Explained)
The stock market serves as a vital bridge between businesses that need capital and individuals who want to grow their wealth. At its core, it’s a marketplace where ownership stakes in companies are bought and sold.
Why the Stock Market Exists
The stock market exists to solve a fundamental problem: companies need money to expand, and people want opportunities to invest their savings for growth. Without this marketplace, businesses would struggle to raise large amounts of capital, and everyday people would have limited ways to participate in economic growth.
How It Connects Companies and Investors
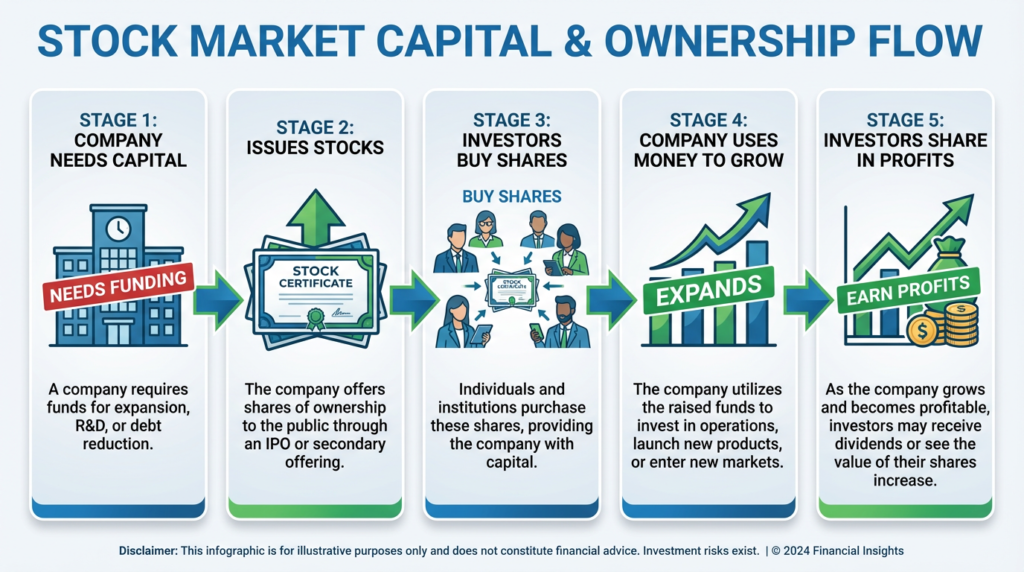
Think of the stock market as a sophisticated matchmaking system. Companies that need funding can offer pieces of ownership (stocks) to the public. Investors who believe in these companies’ futures can purchase these ownership stakes. This creates a mutually beneficial relationship: companies get the funds they need, and investors get the opportunity to share in the company’s success.
How Businesses Raise Money Through Stocks
When a company sells stock, it’s essentially dividing ownership into small, purchasable pieces. If a company is valued at $10 million and issues 1 million shares, each share represents one-millionth of the company’s ownership. The money raised from selling these shares goes directly to the company (during the initial offering), which can then use it to:
- Build new facilities or buy equipment
- Hire more employees
- Invest in research and development
- Expand into new markets
- Pay off existing debts
How Investors Grow Wealth Over Time
Investors make money in the stock market through two primary mechanisms:
Capital appreciation: When you buy a share for $50 and sell it later for $75, you’ve made a $25 profit per share.
Dividends: Some companies share a portion of their profits directly with shareholders through regular cash payments.
Over time, historically, the U.S. stock market has returned an average of about 10% annually, though this varies significantly year to year. This long-term growth potential makes the stock market a powerful tool for building wealth, especially for retirement savings.
How Does the Stock Market Work in Simple Terms?
Let me explain the stock market using an analogy everyone can understand: imagine a massive farmers’ market, but instead of fruits and vegetables, people are buying and selling tiny pieces of companies.
Step-by-Step Explanation in Plain English
Here’s what happens in the stock market on any given day:
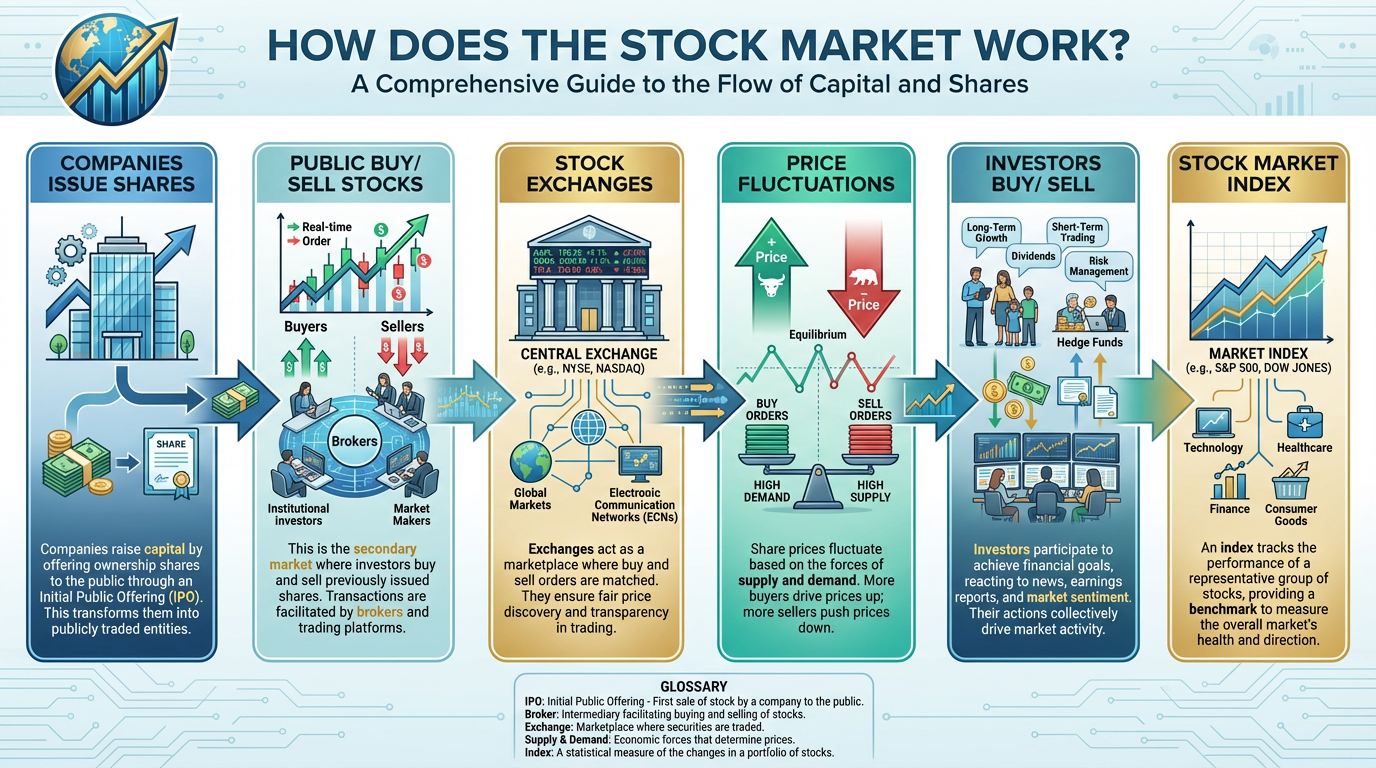
Step 1: Companies list their shares on a stock exchange (like NYSE or NASDAQ), making them available for public trading.
Step 2: Investors decide which companies they want to own a piece of and place orders through their brokerage accounts.
Step 3: Buyers and sellers are matched electronically. When someone wants to buy Microsoft stock at $420 per share, and someone else wants to sell it at that price, a trade happens instantly.
Step 4: The trade is recorded, the buyer receives shares in their account, and the seller receives cash. The transaction typically settles within two business days.
Step 5: This process repeats millions of times per day, with prices constantly adjusting based on supply and demand.
Role of Buyers and Sellers
Buyers are investors who believe a stock’s price will go up. They’re willing to pay today’s price because they expect greater value tomorrow. Sellers are investors who either need cash, want to lock in profits, or believe the stock won’t perform well going forward.
The constant push and pull between buyers and sellers determines the stock’s price at any given moment. If more people want to buy than sell, prices rise. If more people want to sell than buy, prices fall.
Why Prices Change Even When You Do Nothing
You might wonder: “I bought a stock and went to sleep. Why is the price different the next morning?”
Prices change continuously because new information constantly emerges—company earnings reports, economic data, news events, competitor actions, and shifts in investor sentiment all influence what people are willing to pay for a stock. Even if you do nothing, millions of other market participants are making decisions that affect your stock’s price.
Simple Analogy: The Farmers Market
Think of a farmer selling apples. Early in the morning, when supply is abundant and few customers have arrived, apples might sell for $2 per pound. By noon, if the best apples are running low and many customers are shopping, the price might rise to $3 per pound. The apples haven’t changed—demand and supply have.
The stock market works the same way. A company’s fundamental value might not change hour to hour, but the price investors are willing to pay fluctuates constantly based on supply, demand, and expectations about the future.
How Do Companies Enter the Stock Market?
The journey from private company to publicly traded stock is a significant milestone in a business’s evolution. This process opens new doors for growth but also brings increased scrutiny and responsibilities.
What It Means to “Go Public”
“Going public” means a company transitions from private ownership (where shares are held by founders, employees, and private investors) to public ownership (where anyone can buy shares). This transformation fundamentally changes how the company operates.
As a private company, ownership is limited, and shares can’t be easily bought or sold. Once public, the company’s shares trade on stock exchanges, ownership becomes democratized, and the company must meet strict regulatory requirements, including regular financial disclosures.
What an IPO Is
An Initial Public Offering (IPO) is the process through which a private company first sells shares to the public. Here’s how it typically unfolds:
Preparation Phase (6-12 months before):
- The company hires investment banks as underwriters
- Financial audits and legal reviews are conducted
- Registration documents are filed with the SEC
- The company’s valuation is determined
Roadshow (2-3 weeks before):
- Company executives pitch to institutional investors
- Interest is gauged, and the initial price range is set
Pricing and Launch:
- The final IPO price is determined the night before
- Shares begin trading on the chosen exchange
- The first day of trading establishes the public market price
Why Companies Sell Shares to the Public
Companies go public for several strategic reasons:
- Raise significant capital: IPOs can generate hundreds of millions or even billions of dollars, far more than most private funding rounds.
- Increase liquidity: Public shares can be easily bought and sold, making it easier for early investors and employees to realize the value of their ownership.
- Enhance credibility: Being publicly traded signals legitimacy and financial stability to customers, partners, and potential employees.
- Use stock for acquisitions: Public companies can use their stock as currency to acquire other businesses.
- Enable employee compensation: Stock options become more valuable and liquid for employees.
What Happens After a Company Is Listed
Once trading begins, the company enters a new phase of corporate life:
- Quarterly earnings reports must be released, detailing financial performance
- SEC compliance requires ongoing disclosures and filings
- Shareholder meetings must be held where major decisions are voted on
- Stock price scrutiny becomes constant, with every move analyzed by investors and the media
- Board accountability increases as shareholders expect strong governance
The company now has two masters: it must continue operating the business effectively while also meeting the expectations of public shareholders who can buy or sell shares at will.
| Aspect | Private Company | Public Company |
|---|---|---|
| Ownership | Limited to founders, employees, and select investors | Open to anyone who can buy shares |
| Share Trading | Difficult, requires special arrangements | Easy, trades on exchanges daily |
| Financial Disclosure | Private, minimal requirements | Quarterly reports required by the SEC |
| Regulatory Oversight | Limited | Extensive (SEC, exchange rules) |
| Capital Raising | Challenging, limited options | Easier through stock offerings |
| Decision Speed | Faster, fewer stakeholders | Slower, must consider shareholders |
What Happens When You Buy a Stock?
Understanding what actually occurs when you click “buy” can demystify the entire investing process and help you make more informed decisions.
Where Your Money Goes
This is one of the most misunderstood aspects of stock investing. When you buy a stock, your money typically does not go to the company (except during an IPO or secondary offering). Instead, you’re buying shares from another investor who has decided to sell.
Here’s the breakdown of where your money goes:
- To the seller (95-99.9% of your payment): The previous shareholder who owned those shares receives the bulk of your payment.
- To your broker (commission/fees): While many brokers now offer commission-free trading, they may earn money through payment for order flow or other fee structures.
- To market makers (via the bid-ask spread): These intermediaries profit from the small difference between buying and selling prices.
- To the exchange (small regulatory fees): Tiny fees that fund exchange operations and regulatory oversight.
Who Sells the Stock to You
When you buy a stock, the seller could be:
- Another individual investor deciding to cash out or rebalance their portfolio
- Institutional investors, like mutual funds or pension funds, are adjusting their holdings
- Market makers who maintain inventories of stocks to ensure smooth trading
- The company itself (rare, only during buyback programs)
You’ll never know the specific seller’s identity—the market is anonymous. The exchange’s electronic systems simply match your buy order with someone else’s sell order at an agreed-upon price.
What Ownership Actually Means
When you own stock, you hold several rights:
- Voting rights: You can vote on major company decisions at shareholder meetings (typically one vote per share).
- Dividend rights: If the company pays dividends, you receive your proportional share.
- Residual claim: If the company is sold or liquidated, you’re entitled to a share of the remaining assets after debts are paid.
- Access to information: You receive annual reports and important company updates.
However, stock ownership does not give you:
- The right to interfere in daily operations
- Access to company facilities or proprietary information
- Personal liability for company debts (your maximum loss is your investment)
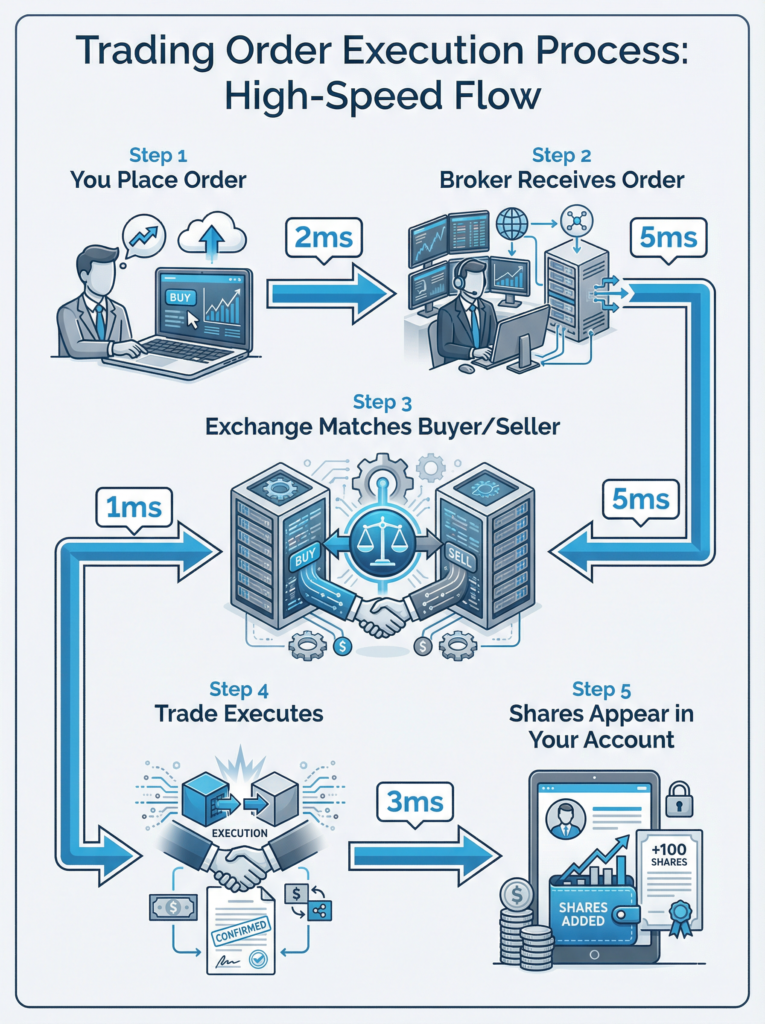
How Trades Are Executed Electronically
Modern stock trading happens at lightning speed through sophisticated technology:
- Order placement: You enter your order (buy 10 shares of Apple at market price) through your broker’s app or website.
- Order routing: Your broker’s system routes your order to an exchange or market maker, typically in milliseconds.
- Order matching: The exchange’s computer system instantly searches for a matching sell order. If someone wants to sell 10 Apple shares at the current market price, you’re matched.
- Execution: The trade executes electronically. You receive confirmation almost instantly.
- Settlement: While execution is instant, official settlement (the formal transfer of shares and money) takes two business days (T+2).
- Confirmation: You’ll see the shares appear in your account immediately (though officially pending for two days), and the cash is deducted from your buying power.
The entire process from clicking “buy” to execution typically takes less than one second during market hours.
What Role Do Stock Exchanges Play?
Stock exchanges are the infrastructure that makes modern investing possible. They’re much more than just places where stocks are bought and sold—they’re sophisticated systems that ensure market integrity and efficiency.
What a Stock Exchange Is
A stock exchange is a regulated marketplace that brings together buyers and sellers of securities. Think of it as a highly organized auction house that operates electronically, processing millions of transactions per day with extreme precision.
Exchanges serve several critical functions:
- Listing venue: Companies must meet specific requirements to have their stocks listed and traded on an exchange.
- Trading platform: Exchanges provide the technology infrastructure where buy and sell orders are matched.
- Price discovery mechanism: By aggregating all buyers and sellers, exchanges help determine fair market prices.
- Regulatory enforcement: Exchanges implement and enforce trading rules to prevent manipulation and fraud.
- Transparency: Exchanges make trading data publicly available so everyone has access to prices and volumes.
NYSE vs NASDAQ
The United States has two primary stock exchanges, each with distinct characteristics:
| Feature | NYSE (New York Stock Exchange) | NASDAQ |
|---|---|---|
| Founded | 1792 | 1971 |
| Structure | Hybrid (electronic + floor traders) | Fully electronic |
| Location | Wall Street, New York City | Times Square (headquarters) |
| Trading Style | Auction market with designated market makers | Dealer market with multiple market makers |
| Company Profile | Traditionally larger, established companies | Historically tech-focused, growing companies |
| Notable Listings | Walmart, Berkshire Hathaway, Coca-Cola, JPMorgan Chase | Apple, Microsoft, Amazon, Tesla, Google |
| Listing Requirements | Generally more stringent | More flexible for newer companies |
| Market Cap | Over $25 trillion | Over $25 trillion |
| Trading Volume | Lower number of trades, higher value | Higher number of trades |
NYSE Characteristics:
- The oldest stock exchange in the U.S.
- Known for its iconic physical trading floor
- Each stock has a Designated Market Maker (DMM) responsible for maintaining orderly trading
- Perceived as more prestigious for traditional companies
- Requires companies to meet stricter financial thresholds
NASDAQ Characteristics:
- First electronic stock exchange
- No physical trading floor—all transactions are computer-based
- Multiple market makers compete for each stock
- Known for technology and growth companies
- More flexible listing requirements attracted many innovative startups
Despite their differences, both exchanges offer similar services to investors, and the choice between them matters more to companies listing their shares than to individual investors buying them.
How Exchanges Ensure Fair Trading
Stock exchanges implement multiple layers of protection to maintain market integrity:
- Circuit breakers: Trading halts automatically if markets drop dramatically (7%, 13%, or 20% in a day) to prevent panic selling.
- Price limits: Many stocks have price bands that pause trading if prices move too far too fast.
- Order types and rules: Exchanges enforce rules about how different order types can be used to prevent manipulation.
- Surveillance systems: Sophisticated algorithms monitor trading patterns for suspicious activity that might indicate insider trading or market manipulation.
- Disclosure requirements: Listed companies must disclose material information to all investors simultaneously, preventing unfair advantages.
- Auditing and reviews: Regular audits ensure companies meet financial reporting standards.
Why Exchanges Matter for Price Discovery
Price discovery is the process by which markets determine the fair value of a stock. Exchanges enable this through:
- Centralized order flow: By bringing together all buyers and sellers in one place, exchanges ensure that prices reflect the collective wisdom of all market participants.
- Transparent order books: You can see the current bid prices (what buyers will pay) and ask prices (what sellers want), helping you understand supply and demand.
- Real-time information: Every trade is recorded and reported immediately, so prices reflect the latest available information.
- Competition among participants: Multiple buyers and sellers compete simultaneously, driving prices toward fair value.
Without exchanges providing this infrastructure, investors would have no reliable way to know whether they’re getting a fair price. The exchange’s role in price discovery is what makes it possible for a teacher in California and a retiree in Florida to trade the same stock with confidence that neither is being taken advantage of.
How Are Stock Prices Decided?
Stock pricing is one of the most fascinating and frequently misunderstood aspects of the market. Unlike grocery stores, where a retailer sets the price, stock prices are determined every second through a dynamic process of negotiation between millions of participants.
Demand and Supply Explained Simply
At its most fundamental level, stock prices are governed by the basic economic principle of supply and demand:
- When demand exceeds supply: More people want to buy a stock than sell it. Buyers must offer higher prices to entice sellers, pushing the price up.
- When supply exceeds demand: More people want to sell than buy. Sellers must accept lower prices to find buyers, pushing the price down.
- When supply equals demand, the price remains relatively stable as buy and sell orders balance.
Think of it like concert tickets. When a popular artist announces a show, tickets might cost $100. If demand is huge and supply is limited, resale prices might jump to $500. If the artist adds more dates (increasing supply), prices come back down. Stock markets work the same way, except the “supply” is all the shares being offered for sale at any moment, and “demand” is all the shares people want to buy.
Role of Buyers’ and Sellers’ Expectations
Here’s where it gets more sophisticated: stock prices don’t just reflect what a company is worth today—they reflect what investors collectively believe it will be worth in the future.
- Optimistic expectations drive prices up: If investors believe a company will grow significantly, they’ll pay more today for future earnings. This is why growth companies often trade at high prices relative to current earnings.
- Pessimistic expectations drive prices down: If investors believe a company faces challenges, they’ll only buy at discounted prices, pushing the stock down even if the company is currently profitable.
- Changing expectations cause volatility: When new information arrives (earnings reports, economic data, news events), expectations shift rapidly, causing dramatic price movements.
This expectation-based pricing explains why:
- A company can report record profits but see its stock fall (if investors expected even better results)
- A company can lose money but see its stock rise (if losses were smaller than feared)
- Stocks can move dramatically on rumors or speculation about the future
Why Prices Change Every Second
During trading hours, stock prices update constantly—sometimes multiple times per second. This happens because:
- Continuous trading: Unlike auctions that happen at set times, stock exchanges operate continuously from 9:30 AM to 4:00 PM Eastern Time.
- New information arrives constantly: News, economic data, analyst reports, social media posts, and thousands of other information sources influence investor decisions in real-time.
- Algorithms and high-frequency trading: Computer programs execute millions of trades per day based on complex algorithms, responding to price movements in microseconds.
- Changing investor sentiment: As traders reassess positions throughout the day, they adjust their buy and sell orders, shifting the supply-demand balance.
- Market makers adjusting: Market makers continuously adjust their bid and ask prices based on order flow and risk management needs.
The current price you see represents the most recent transaction—the last price at which a willing buyer and willing seller agreed to trade. Just seconds later, a new trade at a different price can occur if circumstances change.
Difference Between Company Value and Stock Price
This distinction is crucial for understanding the market:
Company value (intrinsic value) is what the business is fundamentally worth based on:
- Its assets and liabilities
- Its ability to generate future profits
- Its competitive advantages
- Its growth potential
- Industry conditions
Stock price (market value) is what investors are currently willing to pay, based on:
- All the fundamental factors above
- Investor sentiment and psychology
- Supply and demand dynamics
- Market trends and momentum
- External factors (interest rates, economic conditions)
The key insight: Stock prices and company values can diverge significantly in the short term. A great company might have a temporarily depressed stock price due to market pessimism, while a struggling company might have an inflated stock price due to hype or speculation.
Over the long term, stock prices tend to reflect company values more accurately as emotions settle and fundamentals become clear. This is why value investors look for companies where the stock price is significantly below what they believe the company is truly worth—temporary mispricings create opportunity.
| Factor | Short-Term Price Impact | Long-Term Price Impact |
|---|---|---|
| Company earnings | Moderate | Very High |
| News and rumors | Very High | Low |
| Investor sentiment | Very High | Low |
| Economic conditions | High | Moderate |
| Business fundamentals | Moderate | Very High |
| Social media trends | High | Very Low |
| Management quality | Low | High |
| Competitive advantages | Low | Very High |
Why Do Stock Prices Go Up and Down?
Understanding price movements is essential for anyone entering the stock market. While it might seem chaotic, there are identifiable patterns and drivers behind why stocks rise and fall.
Impact of Earnings and Financial Results
Company earnings are the single most important fundamental driver of long-term stock prices. Here’s why:
Quarterly earnings reports: Every three months, public companies report their financial results. These reports show:
- Revenue (total sales)
- Net income (profit after expenses)
- Earnings per share (profit divided by number of shares)
- Future guidance (management’s expectations)
When a company beats earnings expectations, stocks typically rise. When it misses expectations, stocks usually fall. But here’s the nuance: it’s not about absolute performance—it’s about performance relative to expectations.
Example scenarios:
- Scenario 1: Company earns $2 per share, analysts expected $1.50 → Stock rises 8%
- Scenario 2: Company earns $2 per share, analysts expected $2.50 → Stock falls 12%
Same earnings, completely different stock reactions. This illustrates how expectations matter more than absolute numbers.
Long-term earnings trends: Beyond quarterly results, the trajectory of earnings over the years determines whether a stock becomes a long-term winner. Companies that consistently grow earnings tend to see rising stock prices over time, even if there are short-term fluctuations.
Role of News, Interest Rates, and Economic Data
Beyond company-specific factors, broader forces move the entire market:
Company-Specific News:
- Product launches or failures
- Executive changes (new CEO, CFO departures)
- Regulatory approvals or legal troubles
- Major contracts won or lost
- Mergers, acquisitions, or partnership announcements
Interest Rates (set by the Federal Reserve):
- When rates rise, Borrowing becomes more expensive, companies’ profits may shrink, and bonds become more attractive than stocks. Stocks often fall.
- When rates fall: Borrowing is cheaper, business expansion is easier, and stocks become more attractive than bonds. Stocks often rise.
- Interest rates affect how investors value future earnings—higher rates make future profits less valuable today.
Economic Data:
- Jobs reports: Strong employment suggests a healthy economy → stocks rise
- GDP growth: Economic expansion benefits corporate earnings → stocks rise
- Inflation data: High inflation might prompt the Fed to raise rates → stocks may fall
- Consumer confidence: High confidence suggests strong spending → stocks rise
- Manufacturing data: Industrial activity indicates economic health
Market Sentiment and Investor Psychology
Markets aren’t always rational. Human emotions significantly influence price movements:
Fear and Greed Cycle:
- Greed phase: Investors become overconfident, prices rise beyond reasonable valuations, and everyone wants in
- Fear phase: Bad news triggers panic, investors sell indiscriminately, prices fall below fair value
Herd mentality: When investors see others buying, they want to buy too (FOMO – fear of missing out). When selling begins, panic selling can accelerate.
Recency bias: Investors tend to overweight recent events. If stocks have been rising, people expect more rises. If they’ve been falling, people expect more falls—even when fundamentals suggest otherwise.
Overreaction: Markets often overreact to news in the short term, swinging too far in either direction before settling at more reasonable levels.
Famous investor Warren Buffett captured this perfectly: “Be fearful when others are greedy, and greedy when others are fearful.” This contrarian approach recognizes that emotional extremes create opportunities.
Why Short-Term Moves Don’t Reflect Long-Term Value
This is perhaps the most important lesson for beginners:
- Daily volatility is noise: On any given day, stocks might move 2-5% or more on minimal news. This doesn’t mean the company’s long-term value changed by that amount—it means short-term traders and algorithms are reacting to minor events.
- Weekly and monthly moves: Even over weeks or months, stock prices can disconnect from fundamentals as sentiment swings, technical traders chase momentum, or sector rotations occur.
- Long-term trends reflect fundamentals: Over periods of years, stock prices tend to track actual business performance. A company that grows earnings by 15% annually will likely see its stock price rise substantially over a decade, regardless of short-term fluctuations.
Historical perspective: Since 1928, the S&P 500 has had:
- Positive returns in about 53% of all trading days
- Positive returns in about 63% of all months
- Positive returns in about 73% of all years
- Positive returns in about 94% of all 10-year periods
This data shows that the longer your timeframe, the more likely you are to see positive returns, and the less daily volatility matters.
| Price Movement Driver | Typical Impact Duration | Example |
|---|---|---|
| Daily news/tweets | Hours to days | CEO makes statement, stock moves 3% |
| Earnings surprise | Days to weeks | Company beats estimates, stock jumps 10% |
| Analyst rating changes | Days to weeks | Analyst upgrades stock to “buy.” |
| Industry trend shifts | Months to quarters | Shift to electric vehicles affects auto stocks |
| Interest rate changes | Months to quarters | Fed raises rates, market adjusts valuations |
| Earnings growth trajectory | Years | Consistent 20% annual growth drives long-term gains |
| Competitive advantage | Years to decades | Strong brand maintains pricing power |
| Market cycles | Years (3-7 year average) | A bull market followed by a bear market |
Who Are the Main Players in the U.S. Stock Market?
The stock market is an ecosystem with diverse participants, each playing a different role. Understanding who these players are helps you see the bigger picture of how markets function.
Individual Investors
Also called “retail investors,” these are everyday people investing their own money for personal goals like retirement, education, or wealth building.
Characteristics:
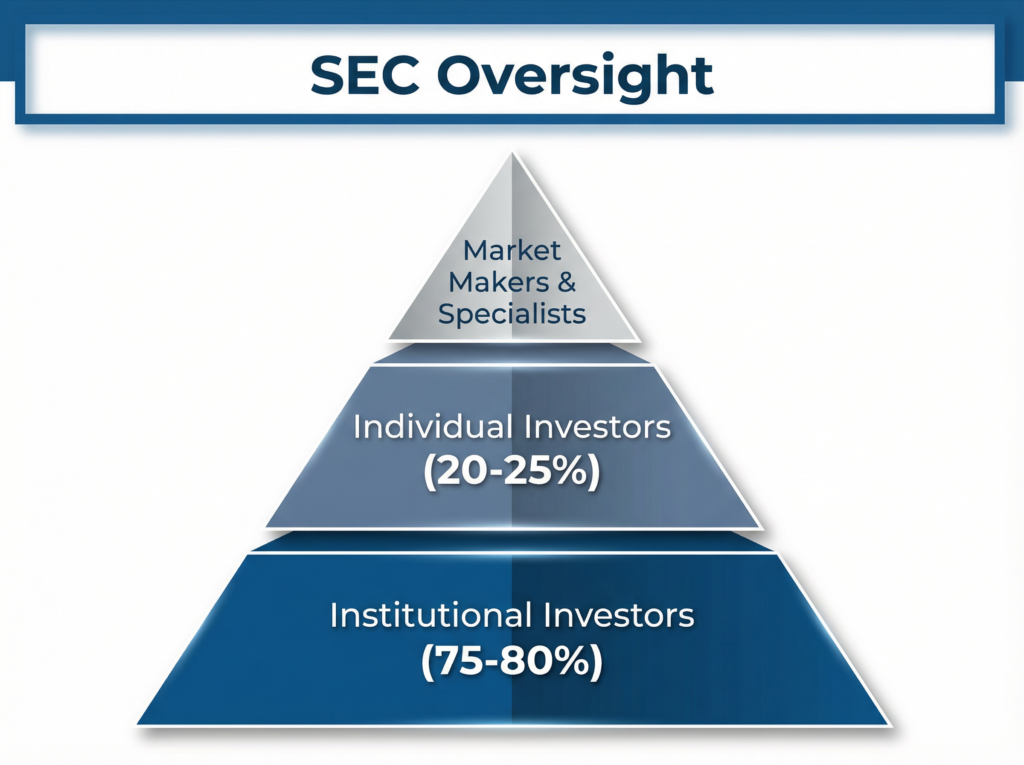
- Represent about 20-25% of daily trading volume
- Typically, buy and hold for longer periods
- Make decisions based on personal research, financial advisors, or online information
- Access markets through brokerage accounts (Fidelity, Charles Schwab, Robinhood, etc.)
- Range from complete beginners to sophisticated traders
Types of individual investors:
- Long-term investors: Hold stocks for years or decades, focused on wealth accumulation
- Active traders: Buy and sell more frequently, trying to profit from short-term price movements
- Passive investors: Invest in index funds that track the overall market
Individual investors have gained significant power in recent years through:
- Commission-free trading platforms
- Access to research and real-time data previously available only to professionals
- Online communities sharing investment ideas and strategies
- Fractional shares allow investment with small amounts of money
Institutional Investors
These are organizations that invest large sums on behalf of others. They represent about 75-80% of daily trading volume and have enormous influence on stock prices.
Major types of institutional investors:
Mutual Funds:
- Pool money from thousands of investors
- Professional managers select and manage portfolios of stocks
- Examples: Fidelity, Vanguard, T. Rowe Price
- Manage trillions of dollars in assets
Pension Funds:
- Manage retirement savings for employees
- Typically invest for very long time horizons (decades)
- Examples: CalPERS (California public employees), Teacher Retirement System of Texas
- Must balance growth with risk management to ensure retirees receive promised benefits
Hedge Funds:
- Private investment partnerships for wealthy individuals and institutions
- Use sophisticated strategies, including short-selling, derivatives, and leverage
- Examples: Bridgewater Associates, Renaissance Technologies
- Often take more aggressive positions than mutual funds
Exchange-Traded Funds (ETFs):
- Similar to mutual funds but trade on exchanges like stocks
- Many track indexes passively (like the S&P 500)
- Examples: SPDR S&P 500 ETF (SPY), Vanguard Total Stock Market ETF (VTI)
- Have grown explosively in popularity
Insurance Companies:
- Invest premium payments to ensure they can pay future claims
- Typically conservative, long-term investors
- Examples: State Farm, Prudential, MetLife
Endowments and Foundations:
- Universities, hospitals, and charitable organizations are investing their capital
- Examples: Harvard Endowment, Bill & Melinda Gates Foundation
Impact of institutional investors:
- Their large trades can move markets significantly
- Their research capabilities often exceed those of individual investors
- They have direct access to company management
- Their buying and selling patterns create trends that others follow
Brokers and Market Makers
These intermediaries keep the market running smoothly:
Brokers:
- Act as agents connecting individual investors to markets
- Execute buy and sell orders on behalf of clients
- Types include full-service brokers (offering advice) and discount brokers (execution only)
- Examples: Charles Schwab, Fidelity, Interactive Brokers, Robinhood
- Make money through commissions (now rare), account fees, or payment for order flow
Market Makers:
- Financial firms that commit to always being ready to buy or sell specific stocks
- Quote both a bid price (what they’ll pay) and an ask price (what they’ll sell for)
- Profit from the spread between bid and ask prices
- Examples: Citadel Securities, Virtu Financial, Jane Street
- Provide liquidity, ensuring you can always trade when you want to
Why market makers matter: Without them, you might not find a buyer when you want to sell or a seller when you want to buy. Market makers ensure you can execute trades immediately at published prices, even if no other investor wants to take the opposite side of your trade at that moment.
Regulators (SEC)
The U.S. Securities and Exchange Commission (SEC) is the primary regulator overseeing the stock market. Created after the 1929 crash to restore investor confidence, the SEC ensures fair and orderly markets.
Key SEC responsibilities:
- Enforce securities laws: Investigate and prosecute market manipulation, insider trading, and fraud.
- Require disclosure: Companies must regularly file detailed financial reports so investors can make informed decisions.
- Register securities: New stock offerings must be registered with the SEC before they can be sold to the public.
- Regulate market participants: Broker-dealers, exchanges, investment advisors, and others must register and comply with SEC rules.
- Protect investors: The SEC’s mission is to protect investors from fraud and ensure markets function fairly.
Other regulatory bodies:
- FINRA (Financial Industry Regulatory Authority): Self-regulatory organization overseeing brokerage firms and their employees
- Federal Reserve: While primarily focused on monetary policy, the Fed monitors financial system stability
- CFTC (Commodity Futures Trading Commission): Regulates derivatives markets
The regulatory framework creates a level playing field where individual investors can participate with confidence, knowing there are rules against manipulation and fraud.
| Player Type | Primary Goal | Typical Holding Period | % of Market Volume |
|---|---|---|---|
| Individual Investors | Personal wealth building | Months to decades | 20-25% |
| Mutual Funds | Grow client assets steadily | Years | 25-30% |
| Pension Funds | Fund future retirement payments | Decades | 15-20% |
| Hedge Funds | Maximum returns, beat the market | Days to years | 10-15% |
| ETFs | Track indexes or sectors | Held by investors (varies) | 20-25% |
| Market Makers | Profit from the bid-ask spread | Seconds to minutes | Facilitate all trades |
| High-Frequency Traders | Exploit tiny price differences | Microseconds to seconds | 40-50% of trades (low value) |
Can Beginners Invest in the U.S. Stock Market?
The short answer is yes—absolutely. The U.S. stock market is more accessible to beginners today than at any point in history. Let’s break down exactly what you need to know to get started.
Who Can Legally Invest
U.S. Citizens and Residents:
- Anyone 18 years or older can open a brokerage account and invest
- Minors (under 18) can invest through custodial accounts managed by parents or guardians (UGMA/UTMA accounts)
- No citizenship requirement—legal residents with proper documentation can invest
Non-U.S. Residents:
- International investors can invest in U.S. stocks
- Requirements vary by country and brokerage
- May need to file W-8BEN form for tax purposes
- Some brokerages specialize in international accounts (Interactive Brokers, TD Ameritrade)
What you’ll need to open an account:
- Social Security Number or Tax ID
- Government-issued ID (driver’s license or passport)
- Proof of address
- Bank account for funding your brokerage account
- Basic personal information (employment, income, investment experience)
No special licenses or certifications required: Unlike becoming a stockbroker or financial advisor, investing your own money requires no professional credentials. You simply need to open an account and fund it.
Minimum Money Required to Start
This is where modern investing has revolutionized access:
Traditional minimum: Historically, many brokerages required $500-$5,000 to open an account.
Today’s reality: Most major brokerages have a $0 minimum to open an account.
- Charles Schwab: $0 minimum
- Fidelity: $0 minimum
- TD Ameritrade: $0 minimum
- E*TRADE: $0 minimum
- Robinhood: $0 minimum
- Webull: $0 minimum
How much should you actually start with?
While you can start with $1, practical considerations suggest starting with more:
$100-$500: Reasonable minimum for beginners
- Enough to buy fractional shares of several companies
- Can build a small diversified portfolio
- Commissions and fees (if any) won’t eat up your returns
$1,000-$5,000: Better starting point
- Can properly diversify across 5-10 different stocks or ETFs
- Larger positions make percentage gains more meaningful
- Less impact from any single investment mistake
Reality check: Only invest money you won’t need for at least 3-5 years and can afford to lose without financial hardship. Stock investing is for long-term goals, not emergency funds or next month’s rent.
Fractional Shares Explained
Fractional shares have democratized investing by removing price barriers:
The old problem: If Amazon stock costs $3,500 per share and you only have $500, you couldn’t invest in Amazon at all. You’d need to save until you had $3,500.
The fractional share solution: You can now buy 0.14 shares of Amazon for your $500 (approximately 14% of one share).
How it works:
- Instead of buying whole shares, you specify a dollar amount to invest
- The brokerage divides one share into tiny pieces
- You own a percentage of a share and receive proportional dividends and gains
Example:
- Google trades at $2,800 per share
- You want to invest $100 in Google
- You buy 0.0357 shares (100 ÷ 2,800)
- If Google rises 10% to $3,080, your $100 becomes $110
Benefits for beginners:
- Invest in expensive stocks with small amounts
- Diversify across multiple companies, even with limited capital
- Dollar-cost average by investing the same dollar amount regularly
Which brokerages offer fractional shares?
- Fidelity: Yes
- Charles Schwab: Yes
- Robinhood: Yes
- Interactive Brokers: Yes
- M1 Finance: Yes
- Vanguard: No (only for mutual funds and ETFs)
Common Beginner Mistakes to Avoid
Learning from others’ mistakes can save you significant money and stress:
Mistake 1: Trying to Time the Market
- The error: Waiting for the “perfect” moment to invest or sell because you think the market will drop
- Why it fails: Even professionals can’t consistently predict short-term market movements
- Better approach: Invest regularly regardless of market conditions (dollar-cost averaging)
Mistake 2: Putting All Money in One Stock
- The error: Investing everything in a single company because you “know” it’ll succeed
- Why it fails: Even great companies can face unexpected problems; one bad event can destroy your portfolio
- Better approach: Spread investments across at least 5-10 different companies or buy index funds
Mistake 3: Panic Selling During Downturns
- The error: Selling stocks when prices drop to “prevent further losses.”
- Why it fails: You lock in losses and miss the eventual recovery; markets have always recovered historically
- Better approach: Accept volatility as normal; only invest money you won’t need for 5+ years
Mistake 4: Chasing Hot Stocks and Trends
- The error: Buying whatever stock is getting hyped on social media or in the news
- Why it fails: By the time something is widely hyped, it’s often overpriced; you’re usually late to the party
- Better approach: Focus on quality companies with solid fundamentals, regardless of hype
Mistake 5: Ignoring Fees and Taxes
- The error: Frequent trading without considering transaction costs and tax implications
- Why it fails: Trading costs and short-term capital gains taxes can erase your profits
- Better approach: Minimize trading; hold stocks at least one year to qualify for lower long-term capital gains rates
Mistake 6: Investing Money You’ll Need Soon
- The error: Using emergency fund money or savings for a down payment to invest
- Why it fails: If the market drops when you need the money, you’re forced to sell at a loss
- Better approach: Only invest money you won’t need for 5+ years; keep 3-6 months of expenses in a savings account
Mistake 7: Not Doing Basic Research
- The error: Buying stocks based on tips without understanding what the company does
- Why it fails: You don’t know what you own, so you can’t make informed decisions about holding or selling
- Better approach: At a minimum, understand the company’s business, competitive advantages, and financial health
| Starting Capital | Recommended Strategy | Realistic Expectation |
|---|---|---|
| $100-$500 | Fractional shares in 3-5 ETFs or large-cap stocks | Learn the process, build habits |
| $500-$1,000 | Mix of ETFs and individual stocks (5-7 holdings) | Small but meaningful portfolio |
| $1,000-$5,000 | Diversified portfolio of 8-12 stocks or ETFs | Proper diversification possible |
| $5,000-$10,000 | Well-diversified portfolio across sectors | Serious investment portfolio |
| $10,000+ | Consider tax-advantaged accounts (IRA, 401k) | Long-term wealth-building foundation |
Is the Stock Market Risky?
Risk is inherent in stock market investing, but understanding the nature and types of risk helps you manage it effectively. The stock market is risky, but not in the way many beginners assume.
Types of Stock Market Risks
Market Risk (Systematic Risk):
- The risk that the entire market declines, affecting nearly all stocks
- Causes: Economic recessions, geopolitical events, pandemics, and interest rate changes
- Example: During the 2008 financial crisis, the S&P 500 fell 50%; even great companies dropped
- Cannot be eliminated through diversification—when the whole market falls, most stocks fall with it
Company-Specific Risk (Unsystematic Risk):
- The risk that an individual company faces problems
- Causes: Poor management, product failures, lawsuits, competitive pressures, industry disruption
- Example: Kodak’s bankruptcy, despite being a photography giant when digital cameras emerged
- Can be reduced through diversification—if you own 20 stocks, one company’s failure hasa limited impact
Volatility Risk:
- The risk of dramatic price swings, even when the company’s fundamental value hasn’t changed
- Short-term volatility is normal and doesn’t necessarily reflect long-term value changes
- Example: A stock might fluctuate 30-40% in a year, but end where it started
Liquidity Risk:
- The risk of being unable to sell a stock quickly at a fair price
- Primarily affects small, thinly-traded stocks
- Large, popular stocks (Apple, Microsoft) have virtually no liquidity risk
Inflation Risk:
- The risk that your investment returns don’t keep pace with inflation
- If you earn 5% but inflation is 7%, your purchasing power declines
- Stocks historically outpace inflation over long periods, unlike cash in a savings account
Timing Risk:
- The risk of investing all your money at a market peak
- Example: Investing everything in March 2000 (dot-com peak) meant waiting years to recover
- Mitigated by investing gradually over time (dollar-cost averaging)
Difference Between Investing and Gambling
This distinction is crucial for maintaining the right mindset:
| Aspect | Investing | Gambling |
|---|---|---|
| Time Horizon | Years to decades | Minutes to hours |
| Basis for Decision | Company fundamentals, research, analysis | Luck, chance, randomness |
| Expected Outcome | Positive over the long term (historically ~10% annually) | Negative over time (house edge) |
| Risk Management | Diversification, research, asset allocation | None—each bet is independent |
| Ownership | You own real assets generating value | You own nothing |
| Probability | Odds improve with time and knowledge | Odds are fixed against you |
| Purpose | Wealth building, retirement, and financial goals | Entertainment, hoping for a quick windfall |
| Historical Success Rate | The majority of long-term investors profit | The majority of gamblers lose |
Why investing isn’t gambling:
- Stocks represent ownership: When you buy stock, you own part of a business that produces products, provides services, and generates profits. You’re not betting on a random outcome.
- Historical positive expectancy: Over the long term, stock markets have risen consistently. From 1928-2024, the S&P 500 has never had a negative 20-year return period. Gambling, conversely, is designed for you to lose over time.
- Value creation: Companies create real economic value—they hire employees, develop products, serve customers, and generate profits. Your returns come from this value creation, not from someone else’s losses.
- Risk can be managed: Through research, diversification, and time horizon management, you can significantly reduce investment risk. Gambling risk cannot be reduced—the odds are what they are.
- Skill matters: Knowledgeable investors who understand businesses and markets tend to achieve better returns over time. In gambling, skill might help marginally, but the house edge remains.
Why Long-Term Investing Reduces Risk
Time is the investor’s greatest ally in managing risk:
Historical market recoveries: Every market crash in history has been followed by recovery and new highs:
- 1929 crash recovered by 1954
- 1987 crash (23% in one day) recovered within two years
- 2000-2002 dot-com crash recovered by 2007
- 2008 financial crisis recovered by 2013
- 2020 pandemic crash recovered within six months
Time smooths volatility: While stocks are volatile year-to-year, returns become more predictable over longer periods:
- 1-year periods: About 73% chance of positive returns
- 5-year periods: About 88% chance of positive returns
- 10-year periods: About 94% chance of positive returns
- 20-year periods: 100% positive returns historically
Compounding works magic: Given enough time, even modest annual returns compound into substantial wealth:
- $10,000 at 10% annual return becomes $25,937 after 10 years
- The same $10,000 becomes $67,275 after 20 years
- After 30 years, it becomes $174,494
Recovery opportunity: If you have a 20-year time horizon and the market crashes tomorrow, you have two decades for recovery. If you need the money in six months, a crash could be devastating.
Real-world example: Someone who invested $10,000 in the S&P 500 in 2008, right before the crash (worst possible timing) would have:
- Lost 50% by March 2009 (down to $5,000)
- Recovered to breakeven by 2013
- Grown to approximately $35,000+ by 2025
Even with terrible timing, patience rewarded the investor with significant gains.
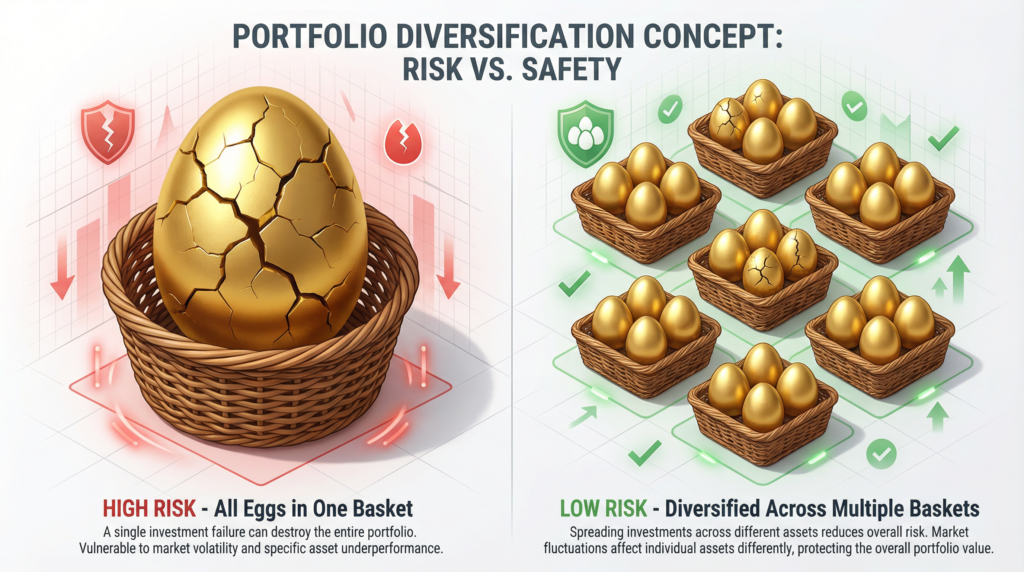
Importance of Diversification
“Don’t put all your eggs in one basket” isn’t just a cliché—it’s fundamental risk management:
How diversification reduces risk:
If you own one stock and it falls 50%, your portfolio falls 50%. If you own 20 stocks and one falls 50%, your portfolio only falls 2.5% (assuming equal weighting).
Types of diversification:
Across companies: Own stocks from multiple companies, not just one or two.
Across sectors: Own stocks from different industries (technology, healthcare, consumer goods, energy, financials). When one sector struggles, others may thrive.
Across market caps: Mix large-cap (established companies), mid-cap (growing companies), and small-cap (smaller companies) stocks.
Across geographies: Include international stocks alongside U.S. stocks to reduce country-specific risk.
Across asset classes: Beyond stocks, consider bonds, real estate, and other investments for true diversification.
The math of diversification:
- 1 stock: 100% of risk concentrated
- 5 stocks: Reduces company-specific risk by approximately 50%
- 15-20 stocks: Reduces company-specific risk by approximately 80-90%
- 30+ stocks: Diminishing returns—not much additional benefit beyond this
Easy diversification for beginners: Index funds and ETFs provide instant diversification.
- S&P 500 index fund owns 500 large U.S. companies
- Total market index fund owns 3,500+ U.S. companies
- An international index fund owns thousands of companies globally
Important caveat: Diversification reduces company-specific risk but does NOT eliminate market risk. In major market downturns, even diversified portfolios decline. However, they typically decline less severely and recover faster than concentrated portfolios.
Long-Term Investing vs Short-Term Trading: What’s Better?
This is one of the most important strategic decisions beginners face. Both approaches exist in the market, but they require different skills, time commitments, and risk tolerances.
Key Differences Explained Simply
| Aspect | Long-Term Investing | Short-Term Trading |
|---|---|---|
| Time Horizon | Years to decades | Days to months |
| Number of Trades | Few (handful per year) | Many (dozens to hundreds per year) |
| Decision Basis | Company fundamentals, business quality | Price patterns, momentum, and technical analysis |
| Time Commitment | Minimal (a few hours per month) | Substantial (hours daily) |
| Tax Treatment | Long-term capital gains (lower rates after 1 year) | Short-term capital gains (ordinary income rates) |
| Stress Level | Lower (ignore daily fluctuations) | Higher (constant monitoring) |
| Success Rate | High (most patient investors profit long-term) | Low (90% of traders lose money) |
| Investment Approach | Buy and hold quality companies | Buy low, sell high repeatedly |
| Knowledge Required | Business understanding, patience | Technical analysis, market timing, trading psychology |
| Costs | Minimal (few commissions, lower taxes) | High (frequent commissions, higher taxes) |
Long-Term Investing Philosophy:
- Buy shares in quality companies and hold for years
- Focus on the business, not daily price movements
- Profit from the company’s growth over time
- Ignore short-term volatility
- The approach famously advocated by Warren Buffett
Short-Term Trading Philosophy:
- Capitalize on price movements over short periods
- Focus on price charts and patterns, not necessarily business quality
- Make many trades to compound small gains
- Requires constant market monitoring
- Approach used by day traders and swing traders
Risk vs Reward Comparison
Long-Term Investing Risk/Reward:
Risks:
- Market downturns can temporarily reduce your portfolio value
- Requires patience through volatility
- Individual companies can fail or underperform
- Opportunity cost if better investments emerge
Rewards:
- Historical average return: ~10% annually (S&P 500 long-term average)
- Compounding multiplies wealth dramatically over decades
- Lower tax rates on long-term capital gains (0%, 15%, or 20% vs. ordinary income rates)
- Reduced stress and time commitment
- Mathematically proven to work for disciplined investors
Short-Term Trading Risk/Reward:
Risks:
- 90% of active traders lose money over time
- Transaction costs (commissions, bid-ask spreads) erode profits
- High tax rates on short-term gains (taxed as ordinary income, up to 37%)
- Emotional stress from constant market monitoring
- Requires significant skill and experience to profit consistently
- Easy to lose substantial money quickly
Rewards:
- Potential for quick profits (if you’re in the successful 10%)
- More excitement and engagement than passive investing
- Can profit in both rising and falling markets (if skilled)
- Active involvement appeals to some personalities
The mathematics are stark:
- If you make 20 trades per year with a 60% win rate (better than most traders), you need your average win to be more than 1.5x your average loss just to break even after taxes and costs
- A long-term investor holding for 10 years needs only one decision (what to buy) to succeed
Why Most Beginners Fail at Trading
Understanding why trading is difficult helps beginners avoid expensive mistakes:
Reason 1: Overconfidence from Early Luck
- Beginners often make money initially during bull markets
- They attribute success to skill rather than rising market conditions
- This breeds overconfidence and larger, riskier bets
- When market conditions change, losses quickly exceed early gains
Reason 2: Emotional Decision-Making
- Trading triggers strong emotions: fear during losses, greed during gains
- Emotional decisions override rational analysis
- Fear causes selling at bottoms; greed causes buying at tops
- Professional traders spend years mastering emotional control
Reason 3: Inadequate Knowledge
- Trading requires understanding technical analysis, market structure, and psychology
- Beginners often trade based on tips, hunches, or partial information
- They compete against professionals with superior tools, information, and experience
- It’s like playing chess against grandmasters after learning the rules yesterday
Reason 4: Underestimating Costs
- Even “commission-free” trading has costs (bid-ask spreads, slippage, SEC fees)
- Short-term capital gains are taxed as ordinary income (up to 37% federal, plus state taxes)
- If you make a $10,000 profit from short-term trading, you might owe $3,000-$4,000 in taxes
- These costs compound: 20 trades per year for 10 years = 200 transactions
Reason 5: Impossible Consistency
- Trading requires being right consistently (not just occasionally)
- Even a 55% win rate (better than most) means you’re wrong 45% of the time
- The psychological toll of losses leads to revenge trading and bigger mistakes
- Professionals with decades of experience still struggle to maintain consistency
Reason 6: Time Demands
- Successful trading requires hours of daily research and monitoring
- Most beginners have jobs, making full-time market attention impossible
- Part-time traders compete against full-time professionals
- Missing key market hours means missing important moves
The Data:
- Studies show 90% of active traders lose money over time
- The average day trader makes less than minimum wage after costs
- Even among professionals, most mutual fund managers fail to beat the S&P 500
- Meanwhile, investors who simply buy and hold index funds consistently profit
What Approach Suits Beginners Best
For 95%+ of beginners, long-term investing is the superior approach:
Start with long-term investing if you:
- Have limited time to monitor markets
- Want to build wealth for retirement or long-term goals
- Prefer lower stress and fewer decisions
- Are new to investing and still learning
- Want to minimize taxes and trading costs
- Can tolerate seeing temporary paper losses without selling
Recommended beginner strategy:
Year 1-2: Focus on low-cost index funds (S&P 500 or total market)
- Learn how markets work without risking much
- Build the habit of regular investing
- Develop emotional discipline through market fluctuations
Year 3-5: Add individual stocks of companies you understand well
- Start with 10-20% of the portfolio in individual stocks
- Research companies thoroughly before buying
- Hold for at least 1-3 years minimum
Year 5+: Consider expanding to international stocks, sector ETFs, or other diversification
- By now, you understand your risk tolerance and investing style
- You’ve experienced at least one market correction
- You have a proven track record of discipline
Only consider short-term trading if you:
- Have years of investing experience and consistent success
- Can dedicate 20+ hours weekly to research and monitoring
- Have capital you can afford to lose entirely
- Understand technical analysis deeply
- Have the emotional discipline to follow strict rules
- Accept that you’re competing against professionals
Realistic advice: Most people who succeed at short-term trading spent years learning through losses before becoming profitable. If you’re determined to try trading, allocate no more than 5-10% of your investable capital to it while keeping the rest in long-term investments. Treat trading tuition as an educational expense, not an investment strategy.
Warren Buffett’s wisdom: “Our favorite holding period is forever.” One of the world’s most successful investors built his wealth not through trading, but through identifying great businesses and owning them for decades. For beginners, this remains the most reliable path to investment success.
How Does the Stock Market Affect the U.S. Economy?
The stock market and the broader economy are deeply interconnected, though not always in the ways people assume. Understanding this relationship helps investors see the bigger picture.
Relationship Between the Stock Market and Economic Growth
The stock market is not the economy, but they influence each other:
What the stock market reflects:
- Investor expectations about future corporate profits
- Business and consumer confidence
- Interest rate environment
- Global economic conditions
- Corporate earnings growth
What the economy reflects:
- Actual employment, wages, and spending
- GDP growth (production of goods and services)
- Real business activity across all sectors
- Living standards for average citizens
Key insight: The stock market looks forward (future expectations) while economic data looks backward (what already happened). Stock prices today reflect what investors think will happen 6-12 months from now.
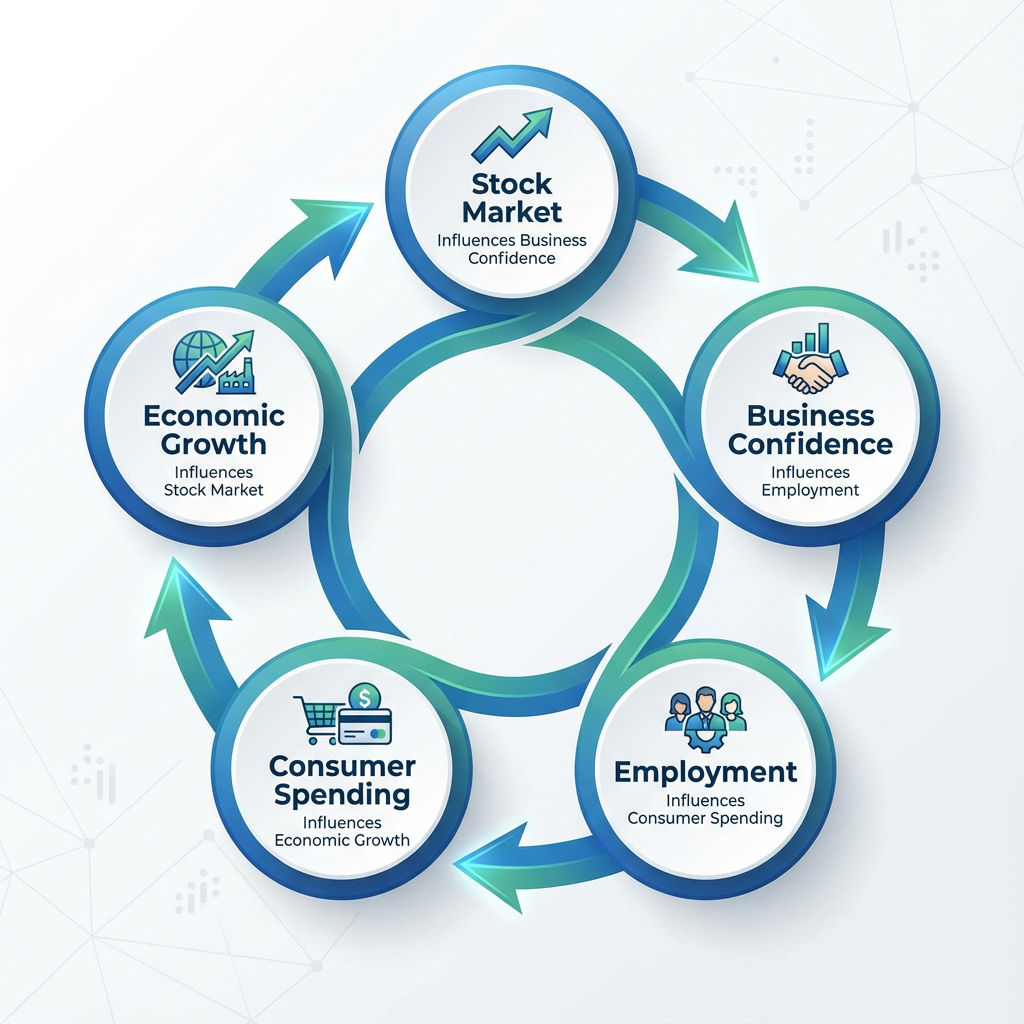
How they connect:
Stock Market → Economy:
- Higher stock prices increase wealth, encouraging consumer spending
- Rising stocks make business expansion easier (companies can raise capital by issuing stock)
- Stock declines reduce consumer confidence and spending
- Market crashes can trigger or worsen recessions
Economy → Stock Market:
- Strong economic growth boosts corporate earnings, lifting stocks
- Low unemployment means more consumer spending, helping businesses
- Economic recessions reduce profits, causing stock declines
- Rising wages can squeeze corporate margins, pressuring stocks
Important caveat: These relationships aren’t perfectly synchronized:
- Stocks can rise while the economy struggles (anticipating future recovery)
- Stocks can fall while the economy is strong (anticipating future problems)
- The market has “predicted nine of the last five recessions” (a famous economist’s quote pointing out false signals)
How Market Performance Reflects Business Confidence
The stock market serves as a real-time confidence meter for the business community:
When markets rise strongly:
- Companies feel confident about future demand
- Businesses invest in expansion, new equipment, and hiring
- Consumer confidence rises (wealth effect)
- Banks are more willing to lend
- Entrepreneurs are more willing to start new ventures
- Merger and acquisition activity increases
When markets fall substantially:
- Companies become cautious, delaying expansion plans
- Hiring freezes or layoffs may begin
- Consumers cut spending (negative wealth effect)
- Credit becomes harder to obtain
- Venture capital and private equity deals slow
- Business investment declines
Real-world example: The COVID-19 Crash and Recovery (2020)
March 2020: The stock market crashed 34% in weeks as the pandemic began
- Businesses immediately cut spending and laid off workers
- Consumer confidence plummeted
- Economic activity froze in many sectors
- GDP contracted at the fastest rate since the Great Depression
Recovery (Late 2020-2021): The stock market rebounded to new highs
- Business confidence returned
- Companies resumed hiring
- Consumer spending bounced back
- The economy recovered faster than most predictions
The stock market’s recovery actually preceded and helped catalyze the economic recovery, demonstrating how market confidence can influence real economic activity.
Impact on Jobs, Retirement Accounts, and Consumer Spending
The stock market touches average Americans’ lives in multiple ways:
Impact on Jobs:
Direct employment:
- The financial services sector employs millions (bankers, brokers, analysts, traders)
- Public companies employ most American workers
- When stock prices are high, companies can raise capital more easily, funding expansion and job creation
Indirect employment:
- Rising stock markets encourage business investment
- Falling markets trigger hiring freezes and layoffs
- Small businesses benefit when investors have capital to deploy
- Construction and manufacturing respond to business investment levels
Correlation (not causation):
- Bull markets are usually associated with declining unemployment
- Bear markets often coincide with rising unemployment
- The causation works both ways—employment affects markets and vice versa
Impact on Retirement Accounts:
This is where the stock market most directly affects average Americans:
401(k) and IRA holdings:
- Over 100 million Americans own stocks through retirement accounts
- A 20% market decline reduces retirement savings by 20%
- A 20% market rise increases retirement wealth by 20%
- Younger workers have time to recover from declines
- Older workers nearing retirement are more vulnerable
Pension funds:
- Public pension funds (teachers, government employees) invest heavily in stocks
- Corporate pension funds likewise depend on stock market returns
- Market declines can create pension funding shortfalls
- This can force higher contributions from employers/governments or reduced benefits
Retirement security:
- Stock market performance over decades determines retirement living standards for millions
- The shift from pensions to 401(k)s means individuals bear more market risk
- Long-term market growth has historically enabled comfortable retirements
- Major market crashes can delay retirement plans by years
Example: Someone with $500,000 in retirement savings in 2008 saw it drop to $300,000 by early 2009 (40% decline). This forced many to delay retirement. Those who stayed invested recovered fully by 2012-2013 and likely exceeded $1 million by 2024.
Impact on Consumer Spending:
The wealth effect:
- When stock portfolios grow, people feel wealthier and spend more
- When portfolios shrink, people tighten their belts and save more
- Economists estimate that each $1 increase in stock wealth increases spending by $0.03-$0.05
- This may seem small, but multiplied across millions of investors, it significantly impacts the economy
Confidence and psychology:
- Rising markets create optimism, encouraging major purchases (homes, cars, vacations)
- Falling markets create pessimism, causing consumers to postpone spending
- Consumer spending represents 70% of U.S. GDP, so these effects ripple through the entire economy
Credit access:
- Stock portfolios serve as collateral for loans (margin loans, home equity lines)
- Rising stock values increase borrowing capacity
- Falling values reduce access to credit
Business spending:
- Consumer goods companies adjust production based on stock-influenced consumer confidence
- The retail sector directly responds to the wealth effect
- The luxury goods sectors especially sensitive to stock market performance
| Market Condition | Business Response | Consumer Response | Economic Impact |
|---|---|---|---|
| Strong Bull Market | Expansion, hiring, investment | Increased spending, major purchases | Economic growth accelerates |
| Steady Growth | Continued operations, moderate investment | Stable spending patterns | Sustained economic expansion |
| Market Volatility | Cautious approach, delayed decisions | Reduced discretionary spending | Economic uncertainty |
| Bear Market | Hiring freezes, cost-cutting | Significant spending reduction | Economic slowdown risk |
| Market Crash | Layoffs, investment halt | Dramatic spending cuts | Recession risk high |
The bottom line
While the stock market isn’t the economy, it’s a powerful economic force. Market movements affect business decisions, employment, retirement security, and consumer spending—all of which feed back into both the market and the economy. Understanding this interconnectedness helps investors see why market health matters beyond just their personal portfolios.
Frequently Asked Questions (FAQ)
Q. How does the stock market work for beginners?
- The stock market works like a marketplace where buyers and sellers trade ownership stakes in companies. As a beginner, you open a brokerage account, deposit money, research companies, or buy index funds, and place orders to buy shares. Your broker executes these orders on stock exchanges where prices are determined by supply and demand. You can hold these shares long-term to participate in the company’s growth, receiving potential profits through rising share prices and dividends.
Q. Is the U.S. stock market safe?
- The U.S. stock market is regulated by the SEC and is among the world’s safest and most transparent markets, with strong investor protections against fraud. However, “safe” doesn’t mean risk-free—stock prices fluctuate, and you can lose money, especially in the short term. The key to safety is a proper approach: diversify your investments, invest only money you won’t need for 5+ years, and maintain a long-term perspective. Historically, the U.S. stock market has always recovered from downturns and reached new highs, making it relatively safe for patient investors but risky for those seeking short-term gains.
Q. How much money do I need to start investing?
- You can start investing with as little as $1 thanks to fractional shares and brokerages with no minimum deposits. However, practically speaking, starting with $100-$500 gives you enough to build a small diversified position, while $1,000-$5,000 allows for meaningful diversification. The more important consideration isn’t the amount but rather that you’re investing money you won’t need for at least 5 years and that losing it wouldn’t cause financial hardship. Start with whatever you’re comfortable with and add to your investments regularly over time.
Q. How do stock prices change?
- Stock prices change continuously during trading hours based on supply and demand. When more investors want to buy a stock than sell it, the price rises as buyers compete by offering higher prices. When more want to sell than buy, the price falls as sellers compete by accepting lower prices. This supply and demand is influenced by countless factors: company earnings, news events, economic data, interest rates, investor sentiment, and expectations about the future. Stock exchanges match buy and sell orders electronically, executing trades in milliseconds and updating prices with each transaction.
Q. Can anyone invest in the stock market?
- Yes, anyone 18 or older can invest in the U.S. stock market, regardless of citizenship (though non-U.S. residents may have additional requirements). You don’t need to be wealthy, hold a license, or have special credentials. Minors under 18 can invest through custodial accounts managed by parents or guardians. You’ll need a Social Security number or tax ID, government-issued identification, proof of address, and a bank account to fund your brokerage account. Most major brokerages now have no minimum deposit requirements, making investing accessible to nearly everyone.
Q. What is the role of the SEC?
- The Securities and Exchange Commission (SEC) is the primary regulator overseeing the U.S. stock market, created after the 1929 crash to protect investors. The SEC enforces securities laws, investigates fraud and market manipulation, requires public companies to disclose detailed financial information regularly, registers new securities before they can be sold to the public, and regulates brokers, exchanges, and investment advisors. Their core mission is ensuring markets operate fairly and transparently so individual investors can participate with confidence that they won’t be cheated or defrauded.
Key Takeaways: How the Stock Market Really Works
Let me distill everything into a clear mental model you can use immediately.
One-Page Mental Model of the Market
What the stock market fundamentally is:
- A marketplace connecting companies needing capital with individuals wanting to grow wealth
- A system where ownership stakes (stocks) in real businesses are bought and sold
- A mechanism where prices are set by collective investor expectations about the future
How it functions day-to-day:
- Millions of buyers and sellers are matched electronically on stock exchanges
- Prices adjust constantly based on supply and demand
- When you buy stock, you’re typically buying from another investor (not the company)
- Your shares represent real ownership with voting rights and a claim on profits
Why prices move:
- Company earnings and financial performance (most important long-term)
- News, economic data, and interest rates
- Investor psychology, sentiment, and expectations
- The constant balance between buyers’ optimism and sellers’ concerns
The key participants:
- Individual investors (you) are buying for personal goals
- Institutional investors (mutual funds, pensions) managing billions
- Brokers connecting you to markets
- Market makers ensure you can always trade
- SEC regulators are protecting against fraud
Risk and reward reality:
- Short-term: Volatile and unpredictable
- Long-term: Historically positive returns (~10% annually)
- Diversification reduces but doesn’t eliminate risk
- Time horizon is your most powerful risk-management tool
What Beginners Should Focus On
Priority 1: Build the Right Foundation
- Open a brokerage account with a reputable firm (Fidelity, Schwab, Vanguard)
- Start with small amounts you can afford to lose
- Invest in low-cost index funds (S&P 500 or total market) for your first investments
- Set up automatic monthly investments to build the discipline
Priority 2: Develop Investor Discipline
- Commit to a long-term time horizon (5+ years minimum)
- Create a diversified portfolio across multiple stocks or use index funds
- Don’t check your portfolio daily—weekly or monthly is sufficient
- Prepare mentally for 20-30% declines and commit to holding through them
Priority 3: Continue Learning
- Read about companies before investing in individual stocks
- Understand basic financial metrics (revenue, earnings, P/E ratio)
- Learn from market cycles and your emotional responses
- Study successful long-term investors like Warren Buffett, not day traders
Priority 4: Avoid Common Traps
- Don’t try to time the market or chase hot stocks
- Resist the urge to sell during market declines
- Don’t invest money you’ll need within 5 years
- Minimize trading to reduce costs and taxes
What matters most:
- Time in the market beats timing the market: Start investing and stay invested
- Consistency beats perfectionism: Regular small investments outperform waiting for perfect moments
- Patience beats activity: Fewer transactions generally mean better returns
- Simplicity beats complexity: Index funds often outperform complicated strategies
What to Ignore in the Early Stage
Ignore these distractions when starting out:
Daily market movements: The market’s daily ups and downs are noise. A 1-2% daily move means nothing for your long-term returns. Check your portfolio infrequently—monthly or quarterly is plenty.
Financial media hype: CNBC, financial Twitter, and investment newsletters often create urgency and fear designed to generate clicks and views, not to help you invest wisely. Limit your exposure to financial media, especially during your first year.
Hot stock tips: Whether from friends, social media, or investment websites, unsolicited stock tips are rarely valuable and often lead to losses. Focus on your own research or stick with index funds.
Complex strategies: Options trading, margin, short-selling, cryptocurrency—these are advanced topics that cause beginners to lose money. Master the basics first. You’ll know when you’re ready for more complex strategies.
Perfect timing: Trying to buy at the absolute bottom or sell at the top is impossible even for professionals. Instead, invest regularly regardless of market levels (dollar-cost averaging).
Market predictions: Economists, analysts, and pundits constantly predict market directions. Most are wrong most of the time. No one knows what the market will do tomorrow, next week, or next month.
Your friends’ investment returns: People tend to brag about wins and hide losses. Don’t feel pressure to match others’ claimed returns or to chase their latest investments.
Short-term underperformance: If your portfolio underperforms for a quarter or even a year, it’s normal. Long-term results are what matter. Warren Buffett underperformed the market for years during the late 1990s tech bubble, then massively outperformed afterward.
Final Thoughts
The U.S. stock market is one of humanity’s most powerful wealth-creation tools, and it’s more accessible today than ever before in history. With no minimum deposits, fractional shares, commission-free trading, and unlimited free educational resources, you can begin your investing journey immediately.
Remember these core truths:
The market rewards patience: Every market decline in history has been temporary. Every long-term investor who stayed disciplined has been rewarded.
Simplicity wins: You don’t need complex strategies or extensive financial knowledge to succeed. Buy quality companies or index funds and hold them for years.
Starting matters more than perfection: The difference between starting today with imperfect knowledge and waiting until you “know enough” could be tens or hundreds of thousands of dollars in lost compound growth.
You’re investing in real value: When you buy stocks, you’re not gambling or playing a game. You’re becoming a part-owner of real businesses creating real value in the world.
The journey from beginner to successful investor isn’t about intelligence or luck—it’s about discipline, patience, and the willingness to keep learning. Start small, stay consistent, think long-term, and you’ll have every advantage you need to build substantial wealth through the stock market.
Welcome to investing. Your financial future starts today.
Disclaimer: This article is for educational purposes only and does not constitute financial advice. Stock investing carries risk, including the potential loss of principal. Past performance does not guarantee future results. Consider consulting with a qualified financial advisor before making investment decisions.

Abhishek Kandir is the founder and lead writer at Paisewaise, a personal
finance publication covering Indian markets, budgeting, and investing since 2023.
Abhishek’s work focuses on making complex financial topics — from RBI
Interventions to SIP strategies — understandable for everyday Indian readers
without a financial background.

