
Introduction
Inflation touches every aspect of our financial lives—from the groceries we buy to the interest rates on our mortgages, from our retirement savings to government economic policy. Over the past five years, inflation has surged to levels not seen in decades, with the U.S. inflation rate peaking at 9.1% in June 2022, the highest since 1981. Understanding what inflation is, what causes it, and how it’s measured is essential for making informed financial decisions and comprehending the economic landscape around us.
This comprehensive guide will explore the fundamental concept of inflation, examine its various causes and types, explain how economists measure it, and discuss its far-reaching implications for individuals and the broader economy.
What Is Inflation and Its Causes
Understanding Inflation
At its simplest, inflation is the rate at which the general level of prices for goods and services rises over time, eroding purchasing power. In technical terms, inflation represents a sustained increase in the aggregate price level in an economy. When inflation occurs, each unit of currency buys fewer goods and services than it did previously.
For example, if inflation is running at 3% annually, something that costs $100 today would cost $103 a year from now. Over time, this compounds significantly—a reality that affects everything from your morning coffee to your retirement savings.
Main Causes of Inflation
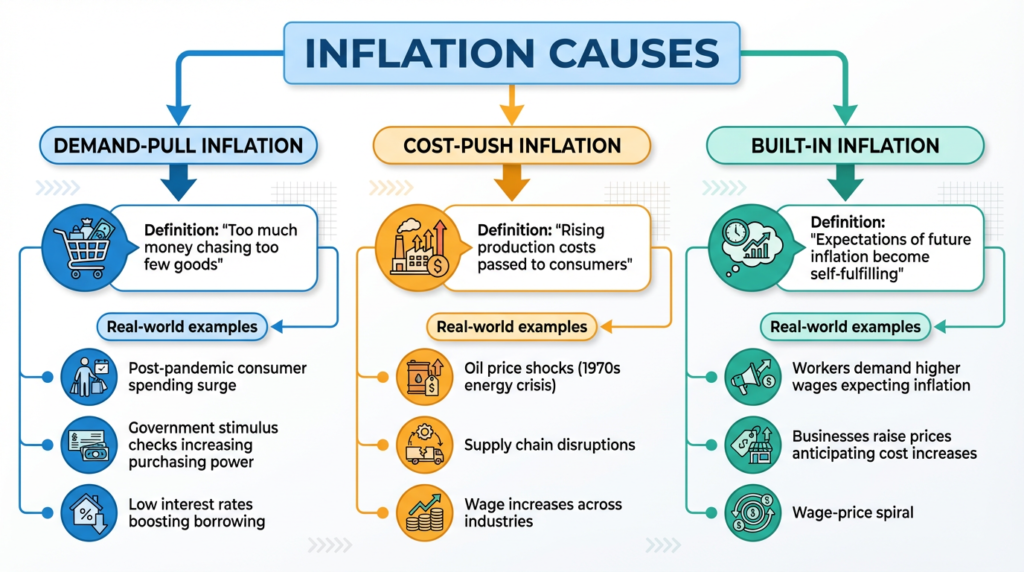
Economists generally identify three primary drivers of inflation:
- Demand-Pull Inflation occurs when aggregate demand in an economy outpaces aggregate supply. When consumers, businesses, and governments are spending more money than the economy can produce goods and services, prices rise. This often happens during periods of economic growth, low unemployment, or expansionary fiscal and monetary policies. The post-pandemic reopening in 2021-2022 provides a clear example, as pent-up consumer demand collided with supply constraints, driving prices sharply higher.
- Cost-Push Inflation results from rising production costs that force businesses to increase prices. When the costs of raw materials, labor, energy, or other inputs rise, companies typically pass these costs on to consumers. The oil price shocks of the 1970s exemplify cost-push inflation, as did the supply chain disruptions and energy price spikes during the COVID-19 pandemic.
- Built-In Inflation, also known as wage-price inflation, creates a self-perpetuating cycle. As prices rise, workers demand higher wages to maintain their purchasing power. Employers then raise prices to cover increased labor costs, which prompts workers to demand even higher wages, and the cycle continues. This mechanism explains why inflation can persist even after initial triggers have subsided.
Real-World Impact
Inflation manifests tangibly in everyday expenses. Food prices reflect both demand-pull factors (more people dining out as incomes rise) and cost-push factors (drought affecting crop yields, higher transportation costs). Housing costs incorporate construction material prices, labor availability, and demand from population growth. Fuel prices respond to global oil markets, geopolitical events, and refining capacity—all of which ripple through the entire economy since transportation costs affect virtually every product.
What Is the Inflation Rate
Defining the Inflation Rate
The inflation rate is the percentage change in the price level over a specific period, typically measured annually or monthly. It quantifies how much prices have increased (or occasionally decreased, in the case of deflation) compared to a previous period.
Calculating Inflation
The calculation is straightforward: take a price index value for the current period, subtract the value from a previous period, divide by the previous period’s value, and multiply by 100 to express it as a percentage.
Formula: Inflation Rate = [(Current Price Index – Previous Price Index) / Previous Price Index] × 100
For example, if the Consumer Price Index was 295.3 in January 2024 and 304.7 in January 2025, the annual inflation rate would be approximately 3.2%.
Current Trends and Historical Context
As of late 2024, U.S. inflation has moderated significantly from its 2022 peak, hovering around 3-4% annually—still above the Federal Reserve’s 2% target but well below the concerning levels of recent years. Historically, the U.S. has experienced periods of both very high inflation (double digits in the late 1970s and early 1980s) and very low inflation or even deflation (during the Great Depression and briefly in 2009).
Short-Term vs Long-Term Rates
Short-term inflation rates can be volatile, influenced by temporary factors like seasonal demand, weather events, or supply disruptions. Long-term inflation rates smooth out these fluctuations and provide a better picture of underlying price trends. Policymakers typically focus on longer-term measures when setting monetary policy, though they monitor short-term movements for signs of accelerating or decelerating inflation.
Historical U.S. Inflation Rates
| Period | Average Annual Inflation Rate | Notable Characteristics |
|---|---|---|
| 1960s | 2.5% | Stable, moderate inflation |
| 1970s | 7.4% | Oil shocks, stagflation |
| 1980s | 5.1% | Peak then sharp decline |
| 1990s | 2.9% | Stable “Great Moderation” |
| 2000s | 2.6% | Continued stability |
| 2010s | 1.8% | Below-target inflation |
| 2020-2024 | 4.8% | Pandemic spike, then moderation |
What Is Inflation and Its Types
Classifications by Severity
Economists categorize inflation by its intensity and speed:
- Creeping Inflation describes mild inflation, typically 1-3% annually. This is generally considered healthy for an economy, encouraging spending and investment while allowing wages and prices to adjust gradually. Most developed nations target this range.
- Walking Inflation represents moderate inflation in the 3-10% range. While not immediately dangerous, it signals potential economic imbalances and warrants policy attention. It can begin to distort economic decisions and erode purchasing power noticeably.
- Galloping Inflation occurs when prices rise by double digits, 10% to hundreds of percent annually. At this level, inflation seriously disrupts economic activity, as people rush to convert money into goods, and long-term contracts become nearly impossible.
- Hyperinflation is catastrophic inflation, typically defined as 50% or more per month. Currencies become worthless, savings evaporate, and normal economic activity collapses. Historical examples include Germany in 1923, Zimbabwe in 2008, and Venezuela more recently.
Headline vs Core Inflation
This distinction is crucial for understanding monetary policy:
- Headline Inflation measures the total inflation in an economy, including all goods and services. It’s what consumers actually experience at the checkout counter and gas pump.
- Core Inflation excludes volatile food and energy prices, focusing on underlying inflation trends. Because food and energy prices can swing dramatically due to weather, geopolitics, or seasonal factors, core inflation provides a clearer picture of persistent inflationary pressures. The Federal Reserve pays close attention to core inflation when setting policy, as it better indicates whether inflation is becoming entrenched in the economy.
Headline vs Core Inflation Comparison
| Measure | What It Includes | Volatility | Policy Use |
|---|---|---|---|
| Headline Inflation | All goods and services, including food and energy | High (subject to supply shocks) | Public communication, COLA adjustments |
| Core Inflation | All goods and services except food and energy | Lower (more stable trend) | Primary Fed policy indicator |
Sector-Specific Inflation
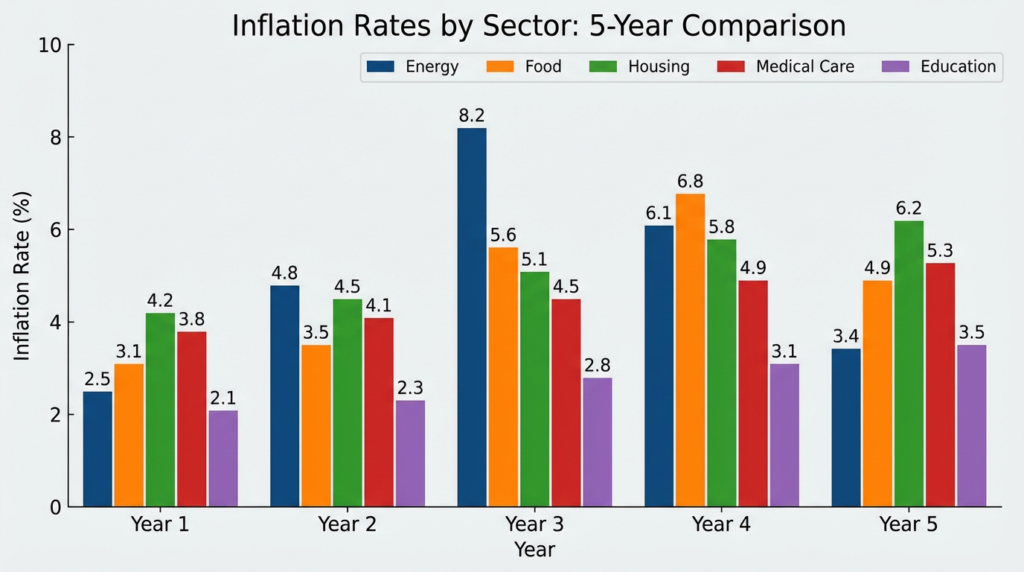
Different sectors experience inflation at different rates:
- Energy Inflation: Highly volatile, driven by global oil markets, refining capacity, and geopolitical events
- Food Inflation: Affected by weather, agricultural yields, transportation costs, and global commodity markets
- Housing Inflation: Influenced by construction costs, land availability, interest rates, and demographic trends
- Medical Inflation: Consistently outpaces general inflation due to technology costs, aging populations, and regulatory factors
- Education Inflation: College tuition has risen far faster than general prices for decades
How Inflation Is Measured
Measuring inflation accurately is essential for policymaking, yet it’s more complex than it might seem. Multiple indexes exist, each with distinct methodologies and purposes.
Consumer Price Index (CPI)
The CPI, published monthly by the Bureau of Labor Statistics, is the most widely recognized inflation measure. It tracks the average change in prices paid by urban consumers for a market basket of goods and services.
- Components: The CPI basket includes eight major categories: food and beverages, housing, apparel, transportation, medical care, recreation, education and communication, and other goods and services. Housing alone accounts for about one-third of the index.
- Methodology: Surveyors collect prices from thousands of retail stores, service establishments, rental units, and doctors’ offices across the country. The data is weighted based on consumer expenditure patterns.
- Strengths: The CPI is timely, comprehensive, and used to adjust Social Security benefits, tax brackets, and many contracts for inflation.
- Limitations: Critics argue the CPI may overstate inflation due to substitution bias (consumers switch to cheaper alternatives when prices rise), quality improvements not fully captured, and new product introductions. The housing component, based partly on “owner’s equivalent rent,” has also been controversial.
Personal Consumption Expenditures (PCE) Price Index
The PCE index, produced by the Bureau of Economic Analysis, is the Federal Reserve’s preferred inflation gauge.
Key Differences from CPI: The PCE captures a broader range of goods and services, including those paid for on consumers’ behalf (like employer-provided health insurance). It also uses a different weighting method that accounts for substitution behavior more dynamically.
Why the Fed Prefers It: The PCE index adjusts more quickly to changes in consumer behavior and is less susceptible to substitution bias. It also covers rural consumers and reflects actual spending more comprehensively.
The PCE typically shows slightly lower inflation than the CPI—often about 0.2-0.5 percentage points less—which matters when the Fed targets 2% inflation.
Producer Price Index (PPI)
The PPI measures inflation from the producer’s perspective, tracking price changes for goods and services before they reach consumers.
Early Warning Signal: Because producer prices often rise before consumer prices, the PPI can provide advance notice of inflation building in the pipeline. When manufacturers pay more for raw materials, they typically pass those costs to retailers and eventually to consumers.
Components: The PPI includes crude goods, intermediate goods, and finished goods, offering insight into inflation at different production stages.
Headline vs Core Measures in Policy
Central banks worldwide focus on core measures when setting policy because they reveal whether inflation is becoming embedded in the economy. A temporary oil price spike might drive headline inflation higher, but if core inflation remains stable, policymakers may view it as transitory. Conversely, rising core inflation suggests broader price pressures that require policy response.
CPI vs PCE Comparison
| Feature | CPI | PCE |
|---|---|---|
| Produced by | Bureau of Labor Statistics | Bureau of Economic Analysis |
| Scope | Urban consumers | All consumers |
| Basket coverage | Out-of-pocket spending | All consumption, including employer-paid |
| Weighting | Fixed (updated periodically) | Chain-weighted (updated continuously) |
| Typical reading | Higher | Lower (by ~0.2-0.5 pp) |
| Primary use | Social Security adjustments, public reference | Federal Reserve policy target |
Economic and Personal Impact of Inflation
Purchasing Power and Cost of Living
Inflation’s most direct effect is eroding purchasing power—the amount of goods and services each dollar can buy. If your income remains flat while prices rise 3% annually, you’re effectively taking a 3% pay cut. Over a decade, 3% annual inflation reduces purchasing power by about 26%.
This affects households differently based on spending patterns. Retirees living on fixed incomes suffer more than working-age people who can negotiate raises. Lower-income households, which spend proportionally more on necessities like food and energy, are hit harder when those categories experience rapid inflation.
Interest Rates and Borrowing
Inflation and interest rates are intimately connected. When inflation rises, central banks typically raise interest rates to cool demand and bring prices under control. Higher rates make borrowing more expensive for mortgages, auto loans, credit cards, and business expansion.
However, existing fixed-rate borrowers can benefit from inflation, as they repay loans with dollars worth less than when they borrowed. This represents a transfer of wealth from lenders to borrowers—one reason why unexpected inflation redistributes wealth throughout the economy.
Savings and Investments
Inflation punishes cash savings. Money sitting in a checking account or low-interest savings account loses value in real terms when inflation exceeds the interest rate. At 3% inflation, $10,000 in a non-interest-bearing account effectively becomes worth $9,700 after one year in purchasing power.
Stock market effects are complex. Moderate inflation often accompanies economic growth, supporting corporate earnings and stock prices. However, high inflation typically prompts aggressive central bank tightening, which can trigger recessions and market downturns. Commodities, real estate, and Treasury Inflation-Protected Securities (TIPS) often perform better during inflationary periods.
The Phillips Curve: Inflation and Unemployment
The Phillips Curve describes the historical inverse relationship between inflation and unemployment—when unemployment is low, inflation tends to rise, and vice versa. This relationship underpins much monetary policy thinking.
The logic is straightforward: tight labor markets give workers bargaining power to demand higher wages, which businesses pass on through higher prices. Conversely, high unemployment dampens wage demands and reduces consumer spending, easing price pressures.
However, this relationship has weakened in recent decades, and periods of “stagflation” (high inflation with high unemployment) can occur, as seen in the 1970s. Modern understanding recognizes that inflation expectations play a crucial role—if people expect higher inflation, they behave in ways that make it self-fulfilling.
Controlling Inflation: Role of the Federal Reserve and Government
Federal Reserve Tools
The Federal Reserve, America’s central bank, bears primary responsibility for controlling inflation through monetary policy.
- Interest Rate Policy: The Fed’s most powerful tool is setting the federal funds rate—the interest rate banks charge each other for overnight loans. When the Fed raises this rate, borrowing throughout the economy becomes more expensive, slowing spending and investment. Lower rates have the opposite effect, stimulating economic activity. The Fed raised rates aggressively in 2022-2023, from near zero to over 5%, to combat high inflation.
- Quantitative Easing and Tightening: During crises, the Fed may purchase government bonds and other securities to inject money into the financial system (quantitative easing or QE), lowering long-term interest rates and encouraging lending. To fight inflation, it can reverse course through quantitative tightening (QT), selling securities or letting them mature without replacement, removing money from circulation.
- Forward Guidance: The Fed also manages expectations through communication, signaling its intentions for future policy. If markets believe the Fed is committed to controlling inflation, it can influence behavior without necessarily taking immediate action.
Government Fiscal Policy
While the Fed handles monetary policy, the federal government’s taxing and spending decisions also affect inflation.
- Fiscal Stimulus: Increased government spending or tax cuts inject money into the economy, potentially fueling demand-pull inflation if the economy is near full capacity. The massive fiscal response to COVID-19, while necessary for many reasons, contributed to subsequent inflation.
- Fiscal Restraint: Higher taxes or spending cuts can cool an overheating economy, though these are politically difficult and can risk triggering recessions.
- Supply-Side Policies: Governments can also address inflation by increasing productive capacity—investing in infrastructure, education, or research; reducing regulatory barriers; or improving supply chains.
Inflation Targeting
Most modern central banks, including the Fed, practice inflation targeting—explicitly aiming for a specific inflation rate (typically 2% for the Fed). This approach provides clarity and anchors inflation expectations, making policy more effective. When people expect stable, low inflation, wages and prices adjust accordingly, creating a self-reinforcing cycle of stability.
Federal Reserve Policy Tools
| Tool | Mechanism | Effect on Inflation | Recent Example |
|---|---|---|---|
| Federal Funds Rate | Raise/lower overnight borrowing costs | Higher rates → lower inflation | Raised from 0-0.25% to 5.25-5.50% (2022-2023) |
| Quantitative Easing | Purchase securities to increase the money supply | Can fuel inflation | Used 2008-2014, 2020-2022 |
| Quantitative Tightening | Sell securities or let them mature | Reduces inflation | Began 2022 |
| Forward Guidance | Communicate future policy intentions | Manages expectations | “Higher for longer” messaging (2023-2024) |
Historical and Global Context of Inflation
Historical Hyperinflation Episodes
History provides sobering lessons about inflation gone catastrophic:
- Weimar Germany (1921-1923): Following World War I, Germany’s decision to print money to pay war reparations led to astronomical inflation. At its peak, prices doubled every few days. Workers were paid multiple times daily and rushed to spend money before it became worthless. The social and political upheaval contributed to conditions enabling the Nazi rise to power.
- Zimbabwe (2007-2009): Political instability, land reform disruptions, and government money-printing created one of history’s worst hyperinflations. Official estimates placed peak monthly inflation at 79.6 billion percent. The currency collapsed entirely, and Zimbabwe eventually abandoned its currency for foreign alternatives.
- Venezuela (2016-Present): Falling oil revenues, economic mismanagement, and money-printing led to hyperinflation exceeding 1 million percent in 2018. The economy contracted dramatically, millions fled the country, and poverty became widespread.
These extreme cases share common features: loss of confidence in government and currency, self-reinforcing expectations of higher prices, and breakdown of normal economic activity.
Developed vs Developing Country Inflation
Developed economies generally experience lower, more stable inflation due to:
- Independent, credible central banks with clear mandates
- Diversified economies are less vulnerable to single-sector shocks
- Deep financial markets that efficiently allocate capital
- Strong institutions and the rule of law
Developing economies often face higher inflation because of:
- Less independent central banks are susceptible to political pressure
- Greater dependence on commodity exports with volatile prices
- Vulnerability to currency crises and capital flight
- Weaker institutional frameworks
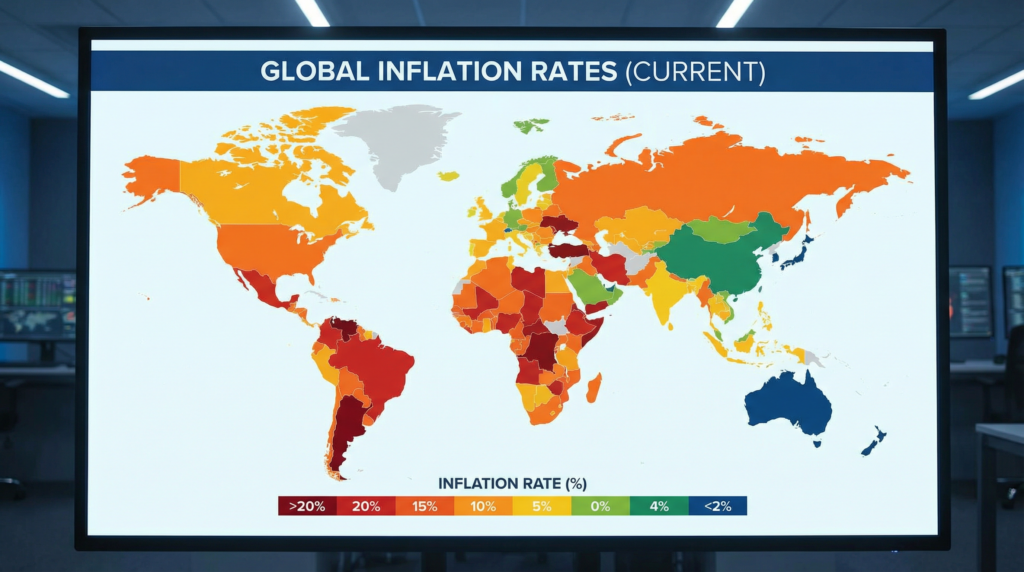
Global Inflation Factors
In our interconnected world, inflation increasingly has global dimensions:
- Oil Prices: Petroleum remains the world’s most important commodity. Oil price shocks—from OPEC decisions, Middle East conflicts, or demand surges—ripple through global economies, affecting transportation costs, electricity generation, and petrochemical inputs.
- Trade Disruptions: Global supply chains mean problems anywhere can create inflation everywhere. The pandemic-era semiconductor shortage affected products from automobiles to washing machines worldwide.
- Supply Chain Vulnerabilities: The “just-in-time” manufacturing model that reduces costs also creates fragility. When COVID-19 shut down factories, congested ports, and created shipping container shortages, global inflation accelerated.
- Currency Movements: A stronger dollar makes imports cheaper for Americans but more expensive for countries whose currencies weaken, potentially importing inflation.
How Individuals Can Protect Themselves from Inflation
While you can’t control macroeconomic forces, you can take steps to protect your finances from inflation’s effects.
Saving Strategies
- High-Yield Savings Accounts: Ensure your emergency fund at least partially keeps pace with inflation by using high-yield accounts or money market funds rather than traditional savings accounts paying minimal interest.
- Treasury Inflation-Protected Securities (TIPS): These government bonds adjust their principal value with inflation, guaranteeing your purchasing power. They’re particularly valuable when inflation expectations are rising.
- I Bonds: Series I Savings Bonds combine a fixed rate with an inflation adjustment, making them attractive during high-inflation periods. However, they have purchase limits and holding-period restrictions.
Investment Strategies
- Equities: Stocks historically outpace inflation over long periods because companies can raise prices, and real economic growth continues despite inflation. Focus on companies with pricing power—those able to pass costs to customers without losing sales.
- Real Estate: Property values and rents tend to rise with inflation, making real estate—whether direct ownership or Real Estate Investment Trusts (REITs)—a traditional inflation hedge.
- Commodities: Physical goods like gold, silver, oil, and agricultural products often rise during inflationary periods. Commodity-focused funds provide easier access than direct ownership.
- Diversification: The most important protection is diversification across asset classes, as different investments perform differently in various inflation scenarios.
Practical Household Adjustments
- Accelerate Major Purchases: If you need a major purchase and can afford it, buying before prices rise further can save money. This is especially true for durable goods.
- Lock in Fixed-Rate Debt: If inflation is expected to rise, locking in fixed-rate mortgages or loans lets you repay with depreciated dollars.
- Negotiate Raises: Ensure your income keeps pace with inflation. Document your value and market rates to justify cost-of-living adjustments.
- Review Subscriptions and Expenses: Inflation makes old prices more visible. Regular expense audits can reveal subscriptions or services no longer worth their cost.
- Build Skills and Education: Human capital—your earning ability—is ultimately the best inflation hedge. Skills and education enhance career prospects and wage-negotiating power.
Inflation Protection Strategies
| Strategy | How It Helps | Risk Level | Liquidity |
|---|---|---|---|
| High-Yield Savings | Reduces purchasing power loss | Very Low | High |
| TIPS | Guarantees real return | Low | Medium |
| Stocks | Growth potential above inflation | Medium-High | High |
| Real Estate | Physical asset appreciation | Medium | Low |
| Commodities | Direct inflation exposure | High | Varies |
| I Bonds | Inflation adjustment + fixed rate | Very Low | Low (1-year minimum) |
Conclusion
Inflation is a fundamental economic force that affects everyone—from retirees watching fixed incomes erode to young professionals navigating career and housing decisions. Understanding what drives inflation, how it’s measured, and what it means for your finances empowers better decision-making.
The past several years have provided vivid lessons in inflation’s power and complexity. From pandemic-driven supply disruptions to unprecedented fiscal and monetary stimulus, from energy price shocks to tight labor markets, multiple factors combined to create the highest inflation in four decades. As central banks have responded with aggressive rate increases, inflation has moderated but remains above target in many countries.
Looking forward, monitoring inflation trends remains essential. Pay attention not just to headline numbers but to underlying core measures that reveal persistent pressures. Understand how the Federal Reserve’s policy decisions affect interest rates, employment, and growth. Most importantly, adapt your personal financial strategies—savings, investments, career development, and major purchases—to the inflationary environment we’re navigating.
Inflation will always be with us in some form. The goal isn’t to eliminate it entirely but to keep it at levels that facilitate economic growth without eroding prosperity. By understanding inflation’s mechanisms and implications, you can protect your financial well-being while appreciating the broader economic forces shaping our world.
Frequently Asked Questions
Q. What is inflation, and why does it happen?
- Inflation is the rate at which the general level of prices for goods and services rises over time, reducing purchasing power. It happens primarily through three mechanisms: demand-pull inflation (demand exceeds supply), cost-push inflation (rising production costs), and built-in inflation (wage-price spirals). Factors like monetary policy, fiscal stimulus, supply disruptions, and commodity price shocks can all trigger or accelerate inflation.
Q. How is inflation measured by the Fed?
- The Federal Reserve primarily uses the Personal Consumption Expenditures (PCE) price index to measure inflation, specifically focusing on core PCE (which excludes food and energy). The Fed prefers PCE over the Consumer Price Index because it covers a broader range of goods and services, adjusts more dynamically to changing consumer behavior, and better reflects actual spending patterns. The Fed targets 2% annual inflation as measured by core PCE.
Q. What is the difference between CPI and PCE?
- The Consumer Price Index (CPI) measures price changes from the consumer’s perspective based on out-of-pocket spending in urban areas, using a relatively fixed basket of goods. The Personal Consumption Expenditures (PCE) index measures price changes based on all personal consumption, including employer-provided benefits, uses chain-weighting that adjusts continuously for substitution effects, and covers both urban and rural consumers. PCE typically shows inflation 0.2-0.5 percentage points lower than CPI.
Q. What is core inflation vs headline inflation?
- Headline inflation measures total price changes across all goods and services, including volatile food and energy prices—what consumers actually pay. Core inflation excludes food and energy to reveal underlying inflation trends less affected by temporary shocks. Policymakers focus on core inflation because food and energy prices can swing dramatically due to weather, geopolitics, or seasonal factors, making headline inflation noisier and less indicative of persistent inflationary pressures.
Q. How does inflation affect interest rates?
- When inflation rises, central banks typically raise interest rates to cool economic demand and bring prices under control. Higher interest rates make borrowing more expensive, reducing spending and investment, which eventually lowers inflation. Conversely, when inflation is below target, central banks lower rates to stimulate economic activity. This relationship means inflation expectations strongly influence interest rates on mortgages, bonds, savings accounts, and all forms of credit throughout the economy.

Abhishek Kandir is the founder and lead writer at Paisewaise, a personal
finance publication covering Indian markets, budgeting, and investing since 2023.
Abhishek’s work focuses on making complex financial topics — from RBI
Interventions to SIP strategies — understandable for everyday Indian readers
without a financial background.


-
-
-
-
-
-
-
-
-
-
-
-
-
-
-
-
Show Comments[…] but by a perfect storm of psychological and social pressures. The primary driver was lifestyle inflation masked as financial sophistication. In her social circle, frequent travel, trendy restaurants, and […]
[…] Indicators: Jobs reports, inflation data, and GDP announcements create trading […]
[…] portrayal distorts expectations about earning and lifestyle inflation in several ways. First, it normalizes spending as the primary expression of wealth rather than […]
[…] Inflation as a Catalyst […]
[…] an American navigating finances in 2024–2025, that sentence probably hit close to home. With inflation reshaping household budgets across the country and the average U.S. household carrying over […]
[…] your hard-earned money is sitting in a traditional savings account right now, inflation is quietly eating it alive — every single day. You’re working hard, making sacrifices, […]
[…] Inflation vs Savings Reality […]
[…] FD Rates vs. Inflation: The Real Return […]
[…] 4. Fuel Prices Are Fueling Inflation […]
[…] Inflation and currency fluctuations […]
[…] Inflation hedge […]
[…] Hedge against inflation […]
[…] Gold acts as a hedge against inflation. […]
[…] Inflation Has Changed the Rules […]
[…] is inflation — and it works quietly, every single day, without sending you a […]
[…] and even everyday goods. By stepping in to stabilize the rupee, the RBI is effectively helping keep inflation in check and protecting your purchasing […]